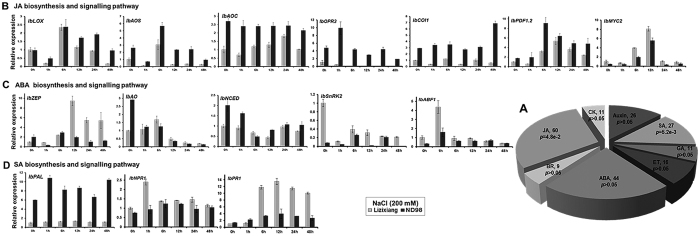
Figure 5. Distribution and expression of the genes in the JA, ABA and SA biosynthesis and signalling pathways.
(A) Analysis of the distribution of genes in phytohormone signalling pathways. The P values were determined using singular enrichment analysis (http://bioinfo.cau.edu.cn/agriGO). The top three categories of phytohormones were JA, ABA and SA, accounting for 64.2% of the DEGs in the hormone class. ABA, abscisic acid; BR, brassinosteroid; CK, cytokinins; ET, ethylene; GA, gibberellin; JA, jasmonic acid; and SA, salicylic acid. (B), (C) and (D) Expression of the key genes in the JA, ABA and SA biosynthesis and signalling pathways, respectively, under salt stress. IbLOX, c154376.graph_c0; IbAOS, c110075.graph_c0; IbAOC, c136730.graph_c0; IbOPR3, c151632.graph_c0; IbCOI1, c148337.graph_c2; IbPDF1.2, c136835.graph_c0; IbMYC2, c143913.graph_c0; IbZEP, c158900.graph_c0; IbAO, c150446.graph_c0; IbNCED, c156411.graph_c0; IbSnRK2, c148195.graph_c0; IbABF1,c125138.graph_c1; IbPAL, c147773.graph_c3; IbNPR1, c151920.graph_c0; IbPR1, c160535.graph_c0.

