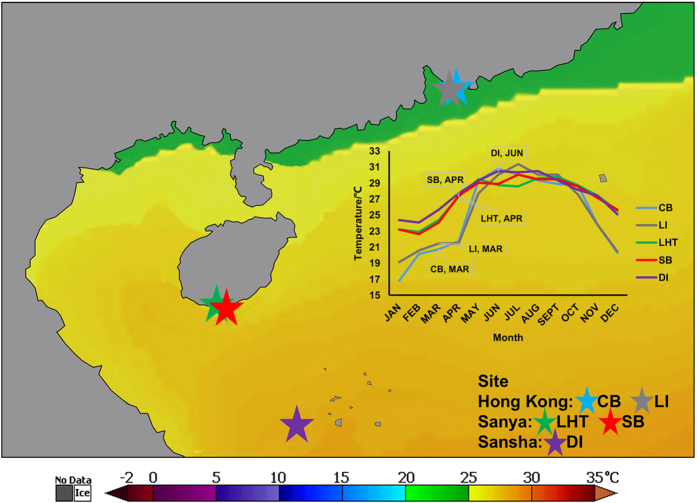
Figure 1. Sampling sites in the South China Sea: Crescent Bay (CB, Hong Kong), Lamma Island (LI, Hong Kong), Luhuitou (LHT, Sanya), Sunny Bay (SB, Sanya) and Drummond Island (DI, Sansha).
The plot displays mean SST for each sampling site in 2014 (NASA Earth Observations) and the labels indicate sampling month for each site. The temperature heatmap was generated on the NOAA Satellite and Information Service website (http://coralreefwatch.noaa.gov/satellite/bleaching5km/index_5km_sst.php) and using NOAA Coral Reef Watch Virtual Stations SST data for 2014 (NOAA Coral Reef Watch. 2014, updated daily. NOAA Coral Reef Watch Annual 5-km Satellite Sea Surface Temperature Product for Coral Triangle, Jan. 1, 2014–Dec. 31, 2014. College Park, Maryland, USA: NOAA Coral Reef Watch. Data set accessed at http://coralreefwatch.noaa.gov/satellite/bleaching5km/index_5km_sst.php) shows the thermal gradient in the South China Sea.

