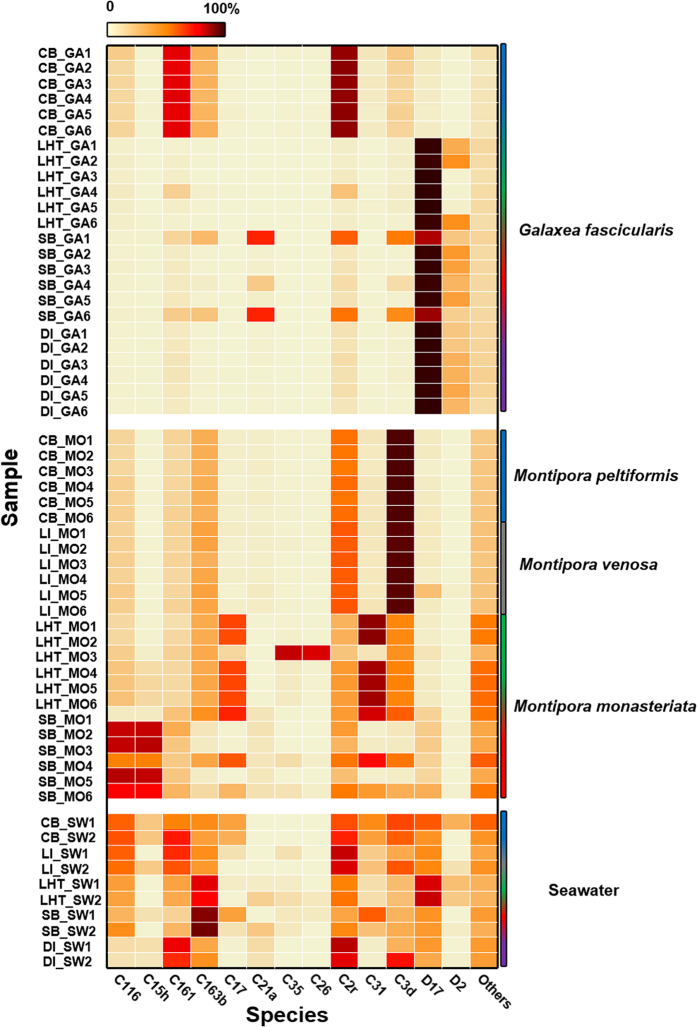
Figure 3. Symbiodinium community structures at the subclade level.
Relative abundance of dominant Symbiodinium subclades from G. fascicularis, Montipora spp., and seawater samples in the South China Sea. The color scale on the top represents the percentage of a subclade from each sample. The color scale on the right represents samples from different sites, blue, grey, green, red and purple represent samples from Crescent Bay (CB, Hong Kong), Lamma Island (LI, Hong Kong), Luhuitou (LHT, Sanya), Sunny Bay (SB, Sanya), Drummond Island (DI, Sansha), respectively. Among the selected Symbiodinium subclades, C17.2, C26.b1, and C21 are equivalent to C17, C35, and C3d, respectively. C26a and C35a are both equivalent to C26.

