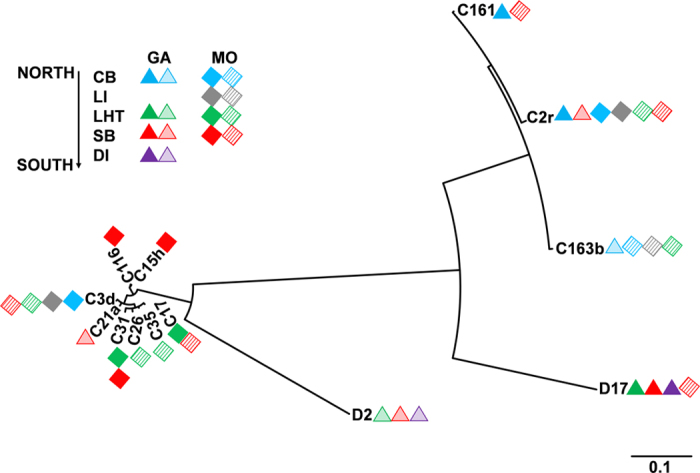
Figure 6. Phylogenetic tree of Symbiodinium subclades that are dominant in G. fascicularis and Montipora spp. in the South China Sea.

Every symbol represents a group in which the average relative abundance of a certain subclade is >1%. Solid and non-solid symbols indicate average relative abundances of >10% and 1–10%, respectively. The phylograms were analyzed with ITS2 sequences using maximum likelihood and Bayesian inference analyses, and nearly identical profiles were obtained. The presented tree is derived from Bayesian inference.
