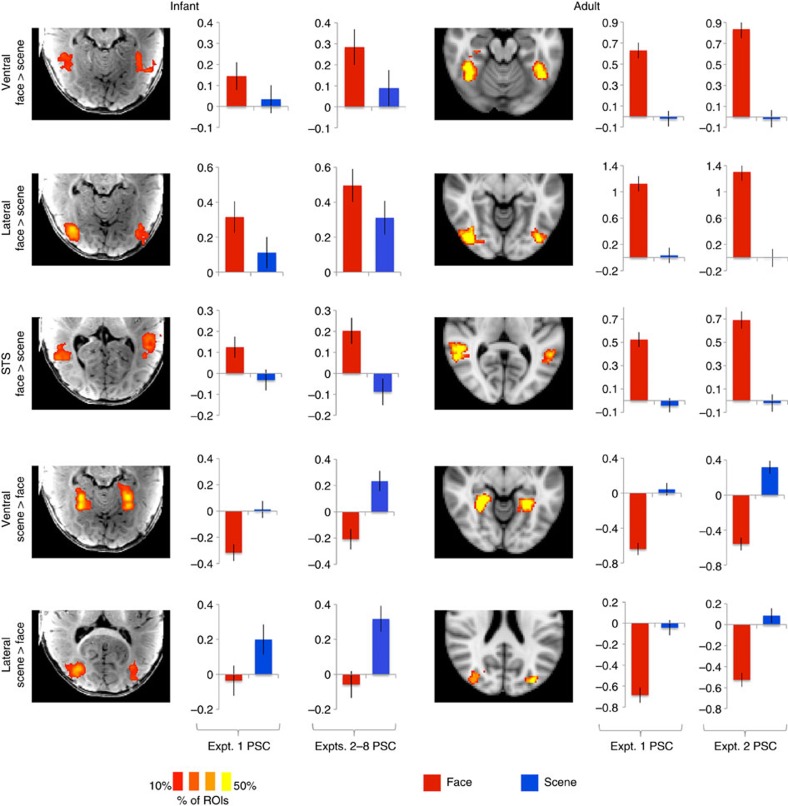
Figure 2. The location and reliability of responses to faces and scenes is consistent across infants and adults.
Brain images show heat maps of region-of-interest (ROI) locations across participants (% of ROIs that included a given voxel), with ROIs defined as the top 5% of voxels responding to faces over scenes (or vice versa) within an anatomical region. Bar plots show each ROI's response (per cent signal change, PSC) to faces and scenes in independent data, separately for Expts. 1, 2–8. Error bars show the standard deviation of a permutation-based null distribution for the corresponding value. Baseline corresponds to the response to scrambled scenes (Expts. 1–3, 7–8) or scrambled objects (Expts. 4–6). Statistics for infant data are presented in the main text; as expected, face and scene preferences were highly significant in adults for all regions (permutation test, n=3; all P's<10−15).

