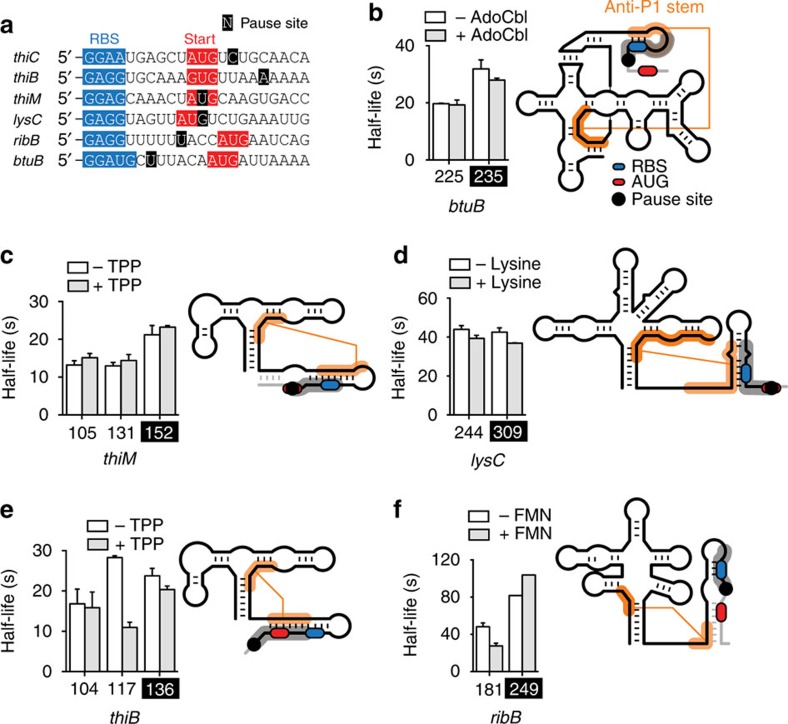
Figure 5. Transcriptional pause regions in E. coli riboswitches.
(a) Sequences of E. coli riboswitch start codons. A single position designates each pausing region, centred around positions 187 (thiC), 136 (thiB), 152 (thiM), 309 (lysC), 249 (ribB) and 235 (btuB). Pause sites, RBS and AUG start codon are indicated in black, blue and red, respectively. (b) Transcriptional pausing in the btuB riboswitch. A schematic representation of the btuB riboswitch is shown on the right and the 235 pause site is indicated. The grey region represents the section of the riboswitch transcript sequestered by the RNA polymerase when stalled at the pause site, thus allowing anti-P1 formation (shown in orange lines). The RBS and AUG start codon are represented in blue and red, respectively. The pause regions and riboswitch sequence are shown in Supplementary Fig. 11. (c) Transcriptional pausing in the thiM riboswitch. A schematic representation of the thiM riboswitch is shown on the right and the pause site at residue 152 is indicated. The colour scheme is identical to the one used in b. The pause regions and riboswitch sequence are shown in Supplementary Fig. 12. (d) Transcriptional pausing in the lysC riboswitch. A schematic representation of the lysC riboswitch is shown on the right and the pause site at residue 309 is indicated. The colour scheme is identical to the one used in b. The pause regions and riboswitch sequence are shown in Supplementary Fig. 13. (e) Transcriptional pausing in the thiB riboswitch. A schematic representation of the thiB riboswitch is shown on the right and the pause site at residue 136 is indicated. The colour scheme is identical to the one used in b. The pause regions and riboswitch sequence are shown in Supplementary Fig. 14. (f) Transcriptional pausing in the ribB riboswitch. A schematic representation of the ribB riboswitch is shown on the right and the pause site at residue 249 is indicated. The colour scheme is identical to the one used in b. The pause regions and riboswitch sequence are shown in Supplementary Fig. 15. The average values of three independent experiments with s.d. s are shown.

