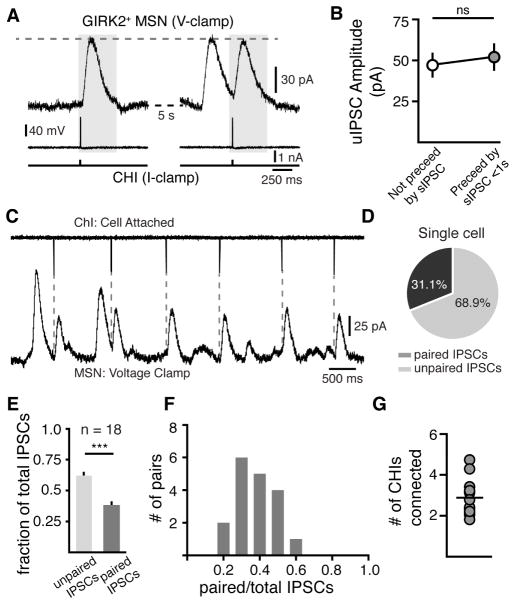
Figure 4. Convergence and functional independence of CHI inputs onto MSNs.
(A) Two traces from a paired CHI-MSN recording separated by 5 s illustrating that the amplitude of uIPSCs were unaffected if immediately preceded by an unpaired sIPSC (grey box). CHIs were hyperpolarized by negative DC current injection and depolarized to threshold with 4 ms 150 pA steps to trigger uIPSCs (bottom trace).
(B) Quantification of uIPSC amplitudes of isolated uIPSCs (not preceeded by an action potential for > 5s) and uIPSCs where a sIPSC occurred in < 1 s prior (n = 15 paired recordings, p > 0.05, Wilcoxon matched-pairs signed rank).
(C) Representative trace of cell-attached paired recordings showing paired and unpaired IPSCs. Dashed line indicate uIPSCs that are paired with the recorded CHI.
(D) Quantified percentage of paired and unpaired IPSCs for the paired recording represented in (A).
(E) Group ratio of paired or unpaired IPSCs to the total number of IPSCs (n = 18 pairs, p < 0.0001, chi-square = 16.067, 1 DOF).
(F) Distribution histogram of paired IPSC ratios (0.1 bin size, n = 18 pairs).
(G) Number of CHIs connected to an MSN in each paired recording. Mean value represented by horizontal line (2.9 ± 0.2 CHIs, n = 18).

