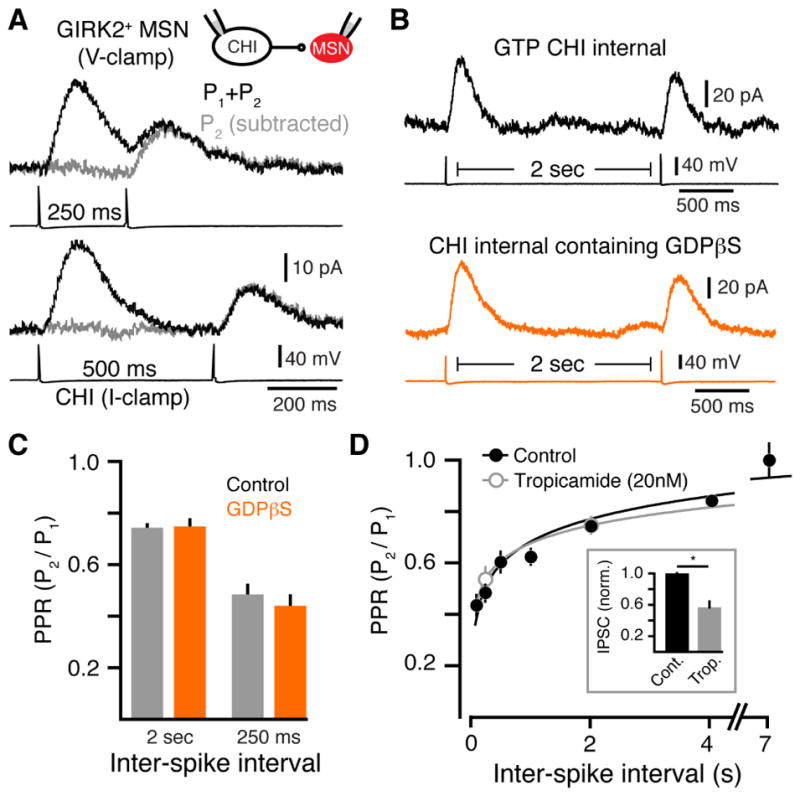
Figure 7. Release properties of ACh at CHI-MSN muscarinic synapses.

(A) Representative traces of uIPSCs evoked by paired pulse stimulation with 250 ms (above) and 500 ms (below) intervals. IPSCs evoked by the second action potential (AP) (grey) were calculated by subtracting the single pulse IPSC for intervals 100 and 250 ms apart.
(B) Representative traces illustrating that the PPR of uIPSCs was not altered when GTP was replaced with GDPβs (0.6 mM) in the intracellular solution.
(C) Summary data of PPRs of uIPSCs evoked at 250 or 2000 ms ISI with either GTP or GDBβs in the intracellular solution.
(D) PPR (P2/P1) for uIPSCs plotted against ISIs of 100, 250, 500, 1000, 2000, 4000 and 7000 ms. PPR is illustrated for uIPSCs under control conditions (black) and in the presence of an IC50 concentration of tropicamide (20 nM) (grey). Inset: inhibition of evoked IPSCs by the IC50 concentration tropicamide (20 nM) (p < 0.05, n = 5, Wilcoxon matched-pairs signed rank).
