
Fig. 2.
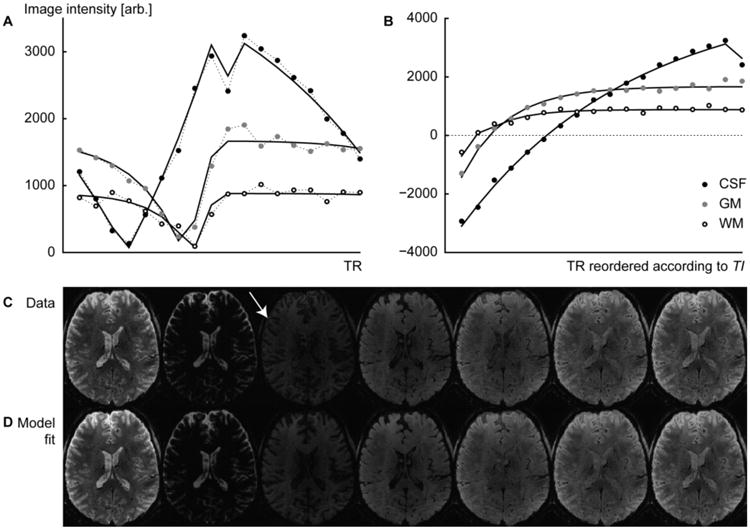
Data and fits to the Bloch equation model of three distinct tissue classes. (A) Data are shown in the order they are sampled during the acquisition for a single inversion recovery period TR. (B) The same data sorted according to TI and vertically reflected left of the zero-signal crossings to visualize the inversion recovery. Note the notch at the end of the CSF curve, caused by the discontinuity in the effective TRα and the less complete recovery of CSF after each inversion recovery period (due to the long T1 value of CSF). (C) The measured data and (D) the corresponding images reconstructed from the model of the parameter image composition. The white arrow points to a signal cancelation effect at the GM-CSF tissue boundary (see Discussion).