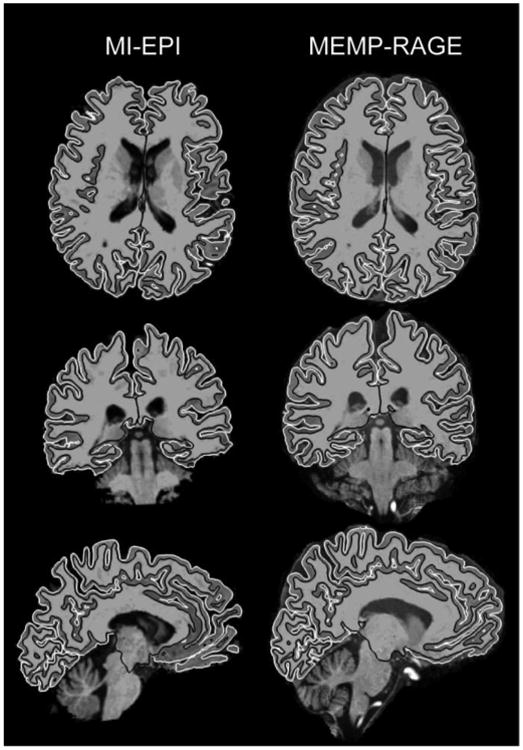
Fig. 4.

Comparison of T1w EPI and MEMP-RAGE images and surface reconstructions. Axial, coronal and left hemisphere sagittal slices are shown for a representative subject at approximately same locations for both image modalities. The images are in their own post-FreeSurfer image matrices instead of co-registered in order to show both image modalities neutrally. Black and white lines shown on the images represent the white and pial surfaces, respectively.
