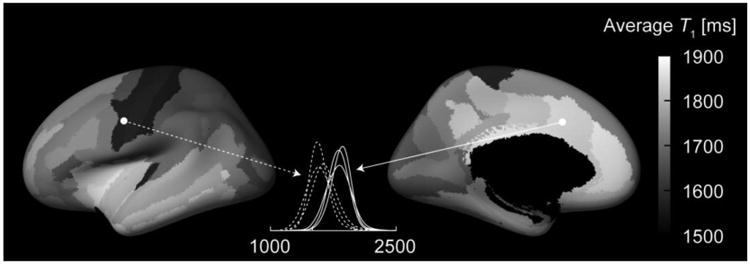
Fig. 9.

Variability of T1 between cortical regions. The lateral and medial views of the inflated cortical surface computed for the template average subject (FreeSurfer fsaverage) are shown. The grayscale overlay represents the T1 value within each parcel of the automatic FreeSurfer parcellations such that each parcellation shows the T1 value of that area. The T1 values were defined for each subject as the values corresponding to the peaks of the probability distribution functions within each parcellation. The maps show the mean across the three subjects scanned without fat saturation (protocol variants C and D). The dashed and solid lines show the consistency of the probability distribution functions of the precentral gyrus and the middle anterior cingulate, respectively, from the three subjects.
