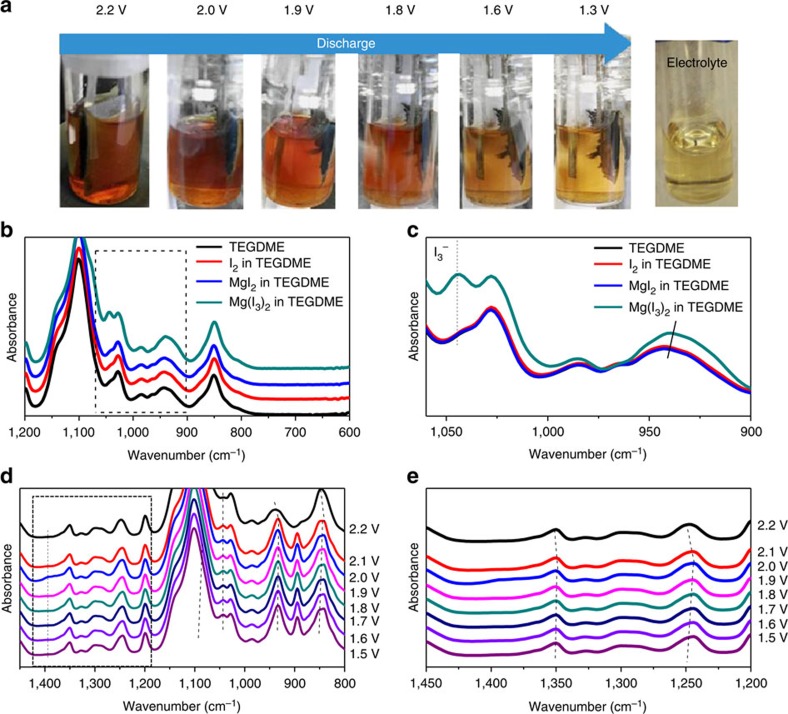
Figure 4. Fourier transform infrared (FT-IR) spectroscopy study of the electrolyte.
(a) Visual images of the discharge process of a Mg/I2 battery at different discharge stages. (b) The controlled FT-IR spectra of I2, MgI2 and Mg(I3)2 in tetraglyme. (c) Magnified view of the regions outlined in b. (d) The ex situ FT-IR spectra of Mg/I2 cell during the discharge process. (e) Magnified view of the regions outlined in d.

