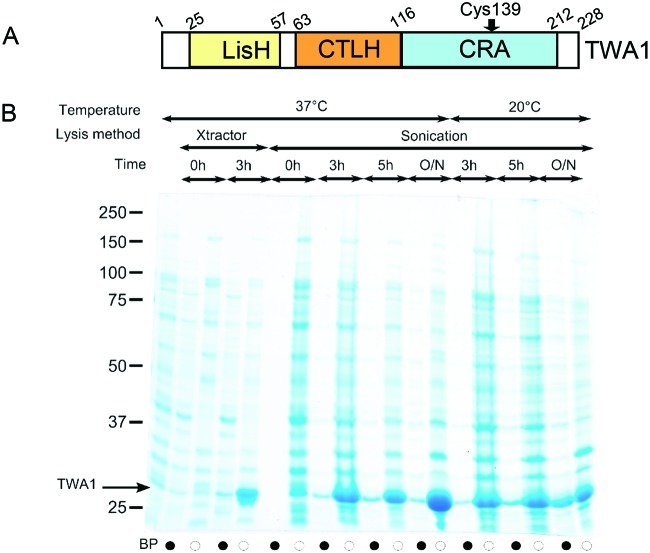
Figure 1. TWA1 and set up of bacterial expression.
(A) Schematic diagram of the domain organization of TWA1. Numbers are based on the human and mouse proteins, which have 99% sequence identity. (B) SDS/PAGE analysis of lysate supernatants (black circles) or lysate pellets (white circles) from TWA1.V5His6-expressing bacteria grown at the indicated temperatures, without or with induction with 1 mM IPTG; BP = bacterial pellet of uninduced cells. Lysates were prepared with commercial buffer (Xtractor) or by sonication. Samples were analysed under reducing conditions on SDS/PAGE (12% gel) and the proteins visualized by Coomassie blue staining.

