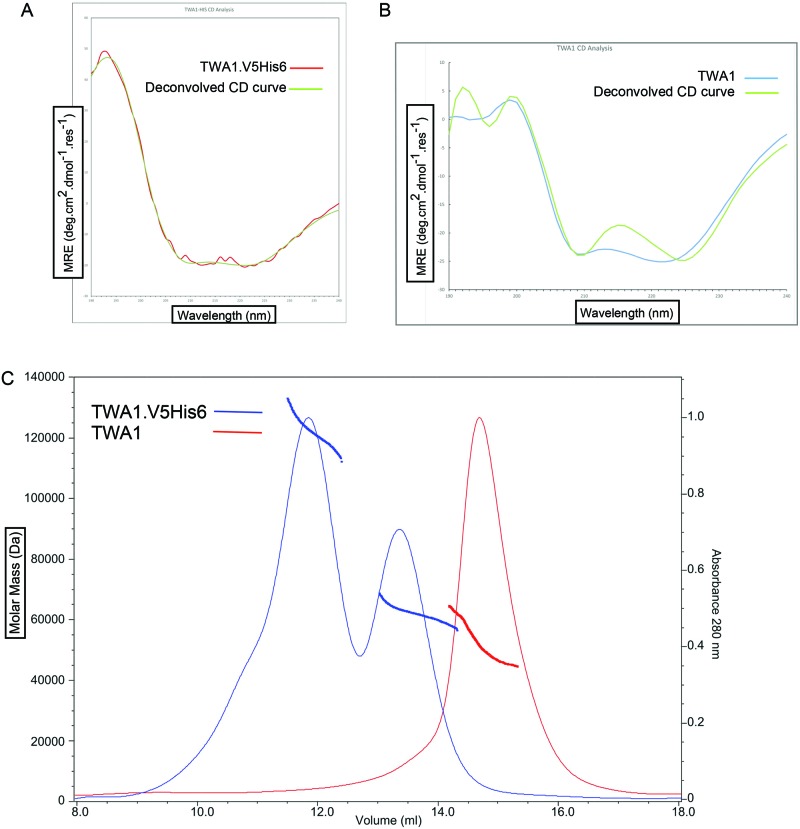
Figure 4. Circular dichroism and SEC-MALS analysis of TWA1.
(A) CD spectrum of TWA1.V5His6 (from 8 scans). (B) CD spectrum of tag-free TWA1 (from 32 scans). Both (A) and (B) also include a superimposed, deconvolved CD curve using Contin-4 and -7 reference sets (dichroweb.cryst.bbk.ac.uk). (C) SEC-MALS chromatograms of the elution of TWA1.V5His6 or tag-free TWA1 from a S200 10/300 GL analytical column. SEC MALS analysis of TWA1 before, (blue) and after, (red), cleavage of the V5His6 tag.

