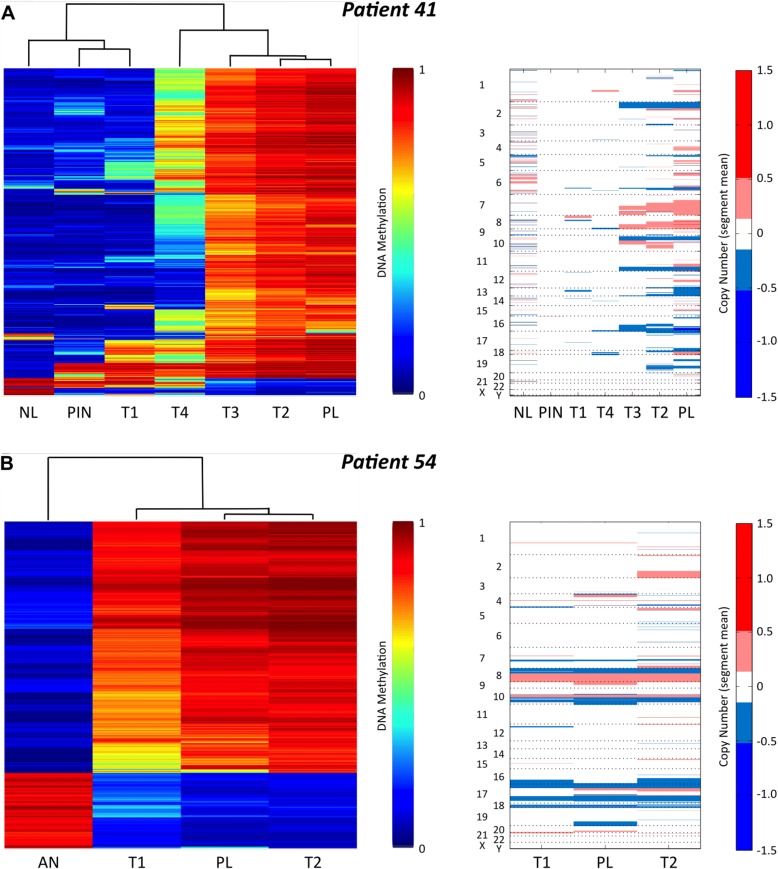
Fig. 3.
DNA methylation patterns of lymph node metastasis indicate the potential primary focus/foci of origin. Left: Unsupervised clustering and heatmaps of all the samples from patient 41 (a) and patient 54 (b) based on the top 1% most variably methylated probes between all samples except the PLs. Dendrograms are shown above the heatmaps and the color key is to the right. Right: Copy number alterations in patient 41 (a) and patient 54 (b). In each plot, samples are ordered based on the unsupervised clustering from the heatmaps to the left. The numbers and letters on the left of the plot designate the chromosome numbers. To the right is shown the color key: red = chromosomal gain and blue = chromosomal loss

