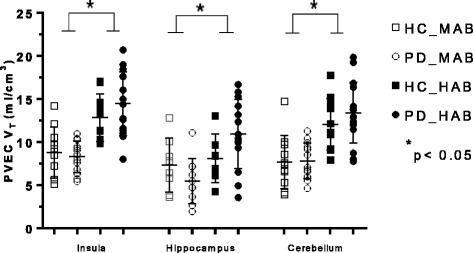
Fig. 2.

Graphs of partial volume effect corrected (PVEC) total distribution volume (V T) in different brain regions. Healthy control with mixed affinity binder (HC-MAB) and healthy control with high affinity binder (HC-HAB) groups as well as Parkinson’s disease with mixed affinity binder (PD-MAB) and Parkinson’s disease with high affinity binder (PD-HAB) groups. Asterisks indicate that the HAB groups show significantly higher V T mean values compared with the MAB groups
