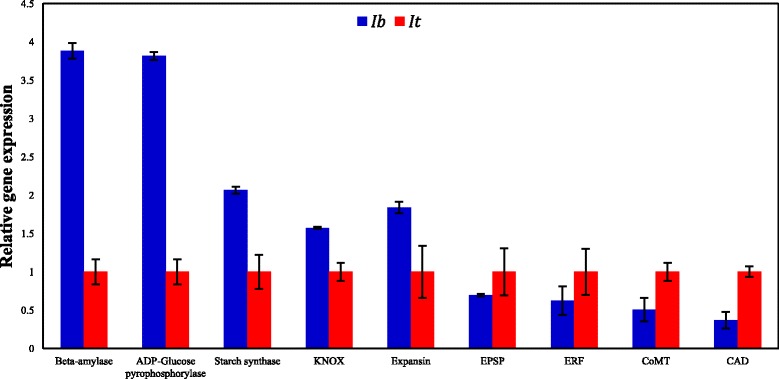
Fig. 3.

Validation of relative expression levels of selected genes (qRT-PCR). Expression levels were compared between I. batatas (Ib; indicated in blue) and I. trifida (It; indicated in red). Quantitative RT-PCR was performed with three biological replicates and two technical replicates for both Ib and It. The sweetpotato β-tubulin gene was used as an endogenous control and the gene expression levels were determined using the ΔΔCt method. Genes are shown with respective TAIR locus IDs: β-amylase (AT4G15210); ADP-glucose pyrophosphorylase (AT4G39210); Starch synthase (AT4G18240); KNOX: class I Knotted-like homeobox (AT4G08150); Expansin (AT2G39700); EPSP: 5- enolpyruvylshikimate-3-phosphate synthase (AT2G45300); ERF: Ethylene-responsive transcription factor (AT1G50640); CoMT: caffeoyl-CoA O-methyltransferase (AT4G34050); CAD: cinnamyl alcohol dehydrogenase (AT1G72680)
