Figure 2.
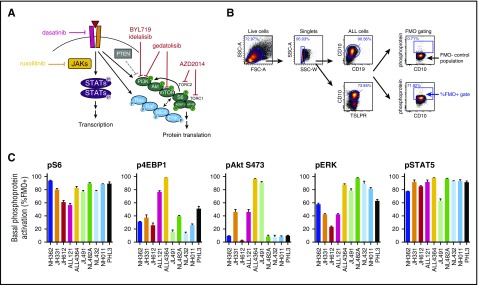
Constitutive activation of signaling phosphoproteins in Ph-like ALL PDX models. (A) Schema of signaling nodes assessed and targets of kinase inhibitors. (B) Gating strategy for phosphoflow cytometry analyses: live singlet CD10+CD19+ (and TSLPR+ if CRLF2-rearranged) human ALL cells in murine spleens were gated. FMO controls were used for each fluorophore-conjugated phosphoprotein antibody to set negative (FMO−) and positive (FMO+) gates. The percentage of cells in the FMO+ gate was calculated for all phosphoproteins for each STI treatment and displayed graphically. All studied ALL samples were uniformly CD10+. (C) Basal levels of each measured phosphoprotein in vehicle-treated mice from each PDX model are displayed as percentages of human ALL cells in FMO+ gates. Data are depicted for each PDX model (colored columns) as mean percentage of cells in FMO+ gate on the y-axis with standard error of the mean (black bars). FSC-A, forward scatter area; SSC-A, side scatter area; SSC-W, side scatter width.

