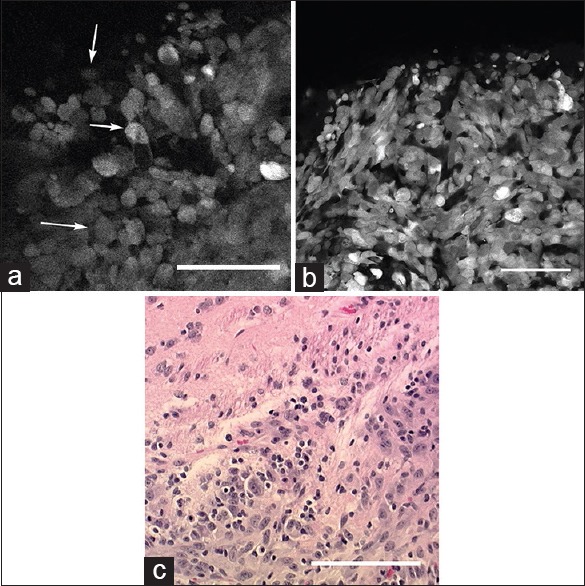
Figure 1.

(a) In vivo image of the tumor border obtained with the confocal endomicroscope demonstrates intracellular distribution of green fluorescent protein. Atypical cells (arrows) consistent with tumor cells are identified within regions of cellular tumor and infiltrating edge. (b) Ex vivo bench-top confocal and (c) Hematoxylin and eosin (×20) images from the same region of interest demonstrate atypical cells within the tumor and tumor edge, similar to the in vivo image. Scale bar 100 μm. Used with permission from Barrow Neurological Institute, Phoenix, Arizona
