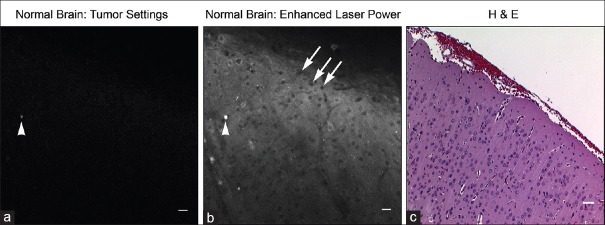
Figure 7.
Seven-fold greater laser power required to visualize autofluorescence from tumor-free brain regions. Note corresponding fluorescent artifact between images (arrowhead) and non-labeled cell bodies (arrows). Image (a) taken with confocal endomicroscope, image (b) taken with bench-top Zeis 710 confocal microscope (higher laser power), and image (c) is the corresponding Hematoxylin and eosin image. Scale bar equals 20 μm. Used with permission from Barrow Neurological Institute, Phoenix, Arizona

