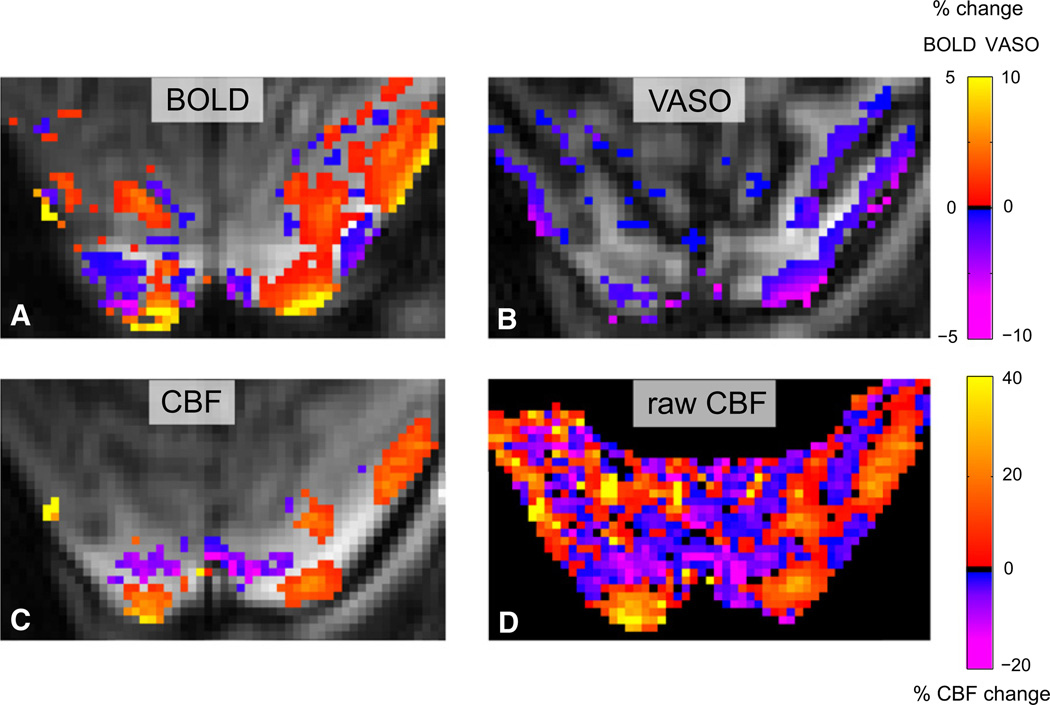
Figure 5. Simultaneously Acquired BOLD, CBV, and CBF Signals Show the Same Behavior as Sequentially Acquired Data.
The negative BOLD signal is accompanied by a decrease in blood flow and an increase in blood volume.
BOLD response (A), VASO-based functional CBV (B), and functional CBF (C) (p < 0.05, cluster size ≥ 16 voxels). The CBF decrease in some of the unstimulated regions failed to reach significance because the negative CBF response was 5%–10%, which was smaller than the detection threshold of ~10% for this scan. The unthresholded CBF (D) shows the decreased CBF in the unstimulated regions. Spatial resolution, 1 × 0.67 × 3 mm3; TI, 925/1,300 ms; TR, 3,000 ms; TE, 8.4, 8.4, and 30.5 ms. The values of 8.4 ms refer to the echoes for CBV and CBF shown in (B), (C), and (D), and the value of 30.5 refers to the BOLD echo shown in (A).

