Fig. 7.
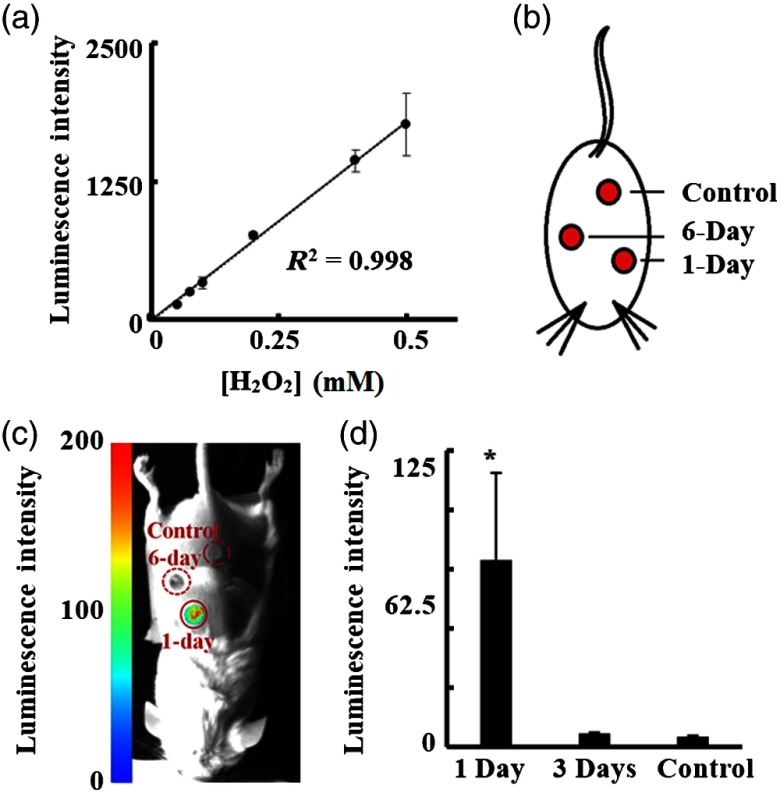
Luminescent imaging of ROS activities in vitro and in vivo. (a) A linear relationship was observed between increasing ROS-producing and luminescent intensity in vitro. (b) An illustration of an excisional wound mouse model with different age wounds (1-day and 6-day) and healthy skin as control. (c) A representative luminescent image shows wounds of different ages display varying degrees of ROS activity. (d) The ROS activities in 1-day and 6-day wounds and controls were quantified and statistically analyzed.

