. 2016 Dec 28;24(4):303–311. doi: 10.4250/jcu.2016.24.4.303

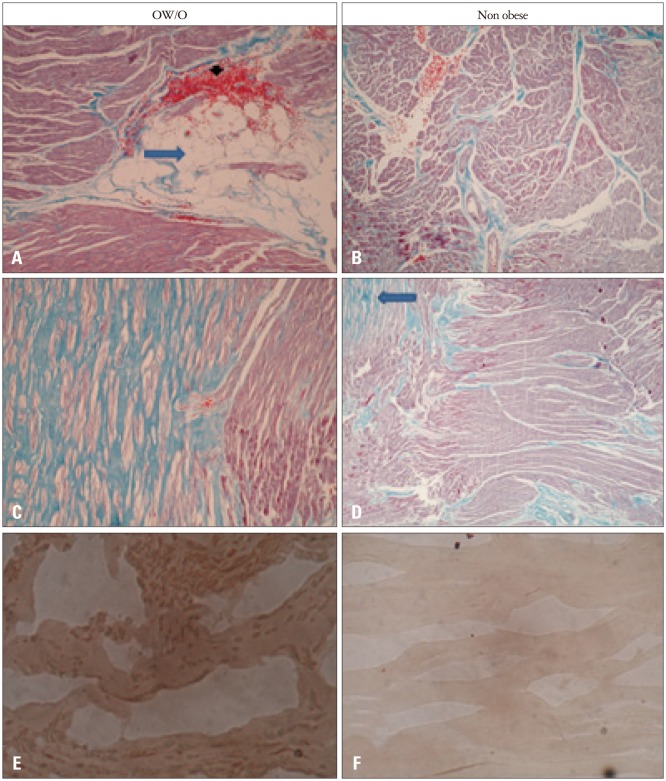
Fig. 2. Microphotographs of myocardial biopsies. A: Focal adipose infiltration evidenced by the presence of adipocytes (arrow) and a small area of hemorrhage (arrowhead) resulting from the procedure (Masson × 10). B: Myocardial fascicles pointing in different directions and thin connective tissue septa separating them (blue); no adipocytes are observed (Masson × 4). C: Extensive area of fibrosis in blue contrasting with the red myocardium (Masson × 10). D: Muscle fascicles (red) pointing in different directions and limited by thin connective tissue septa. The myocardium shows evidence of fibrosis in a small subendocardial area (arrow) (Masson × 10). E: Myocardial microphotograph after lipid staining. Abundant reddish vacuoles are observed in the myocyte cytoplasm (Oil Red × 40). F: No red vacuoles are observed within the fibers (Oil Red × 40). OW/O: overweight or obesity.

Fig. 2