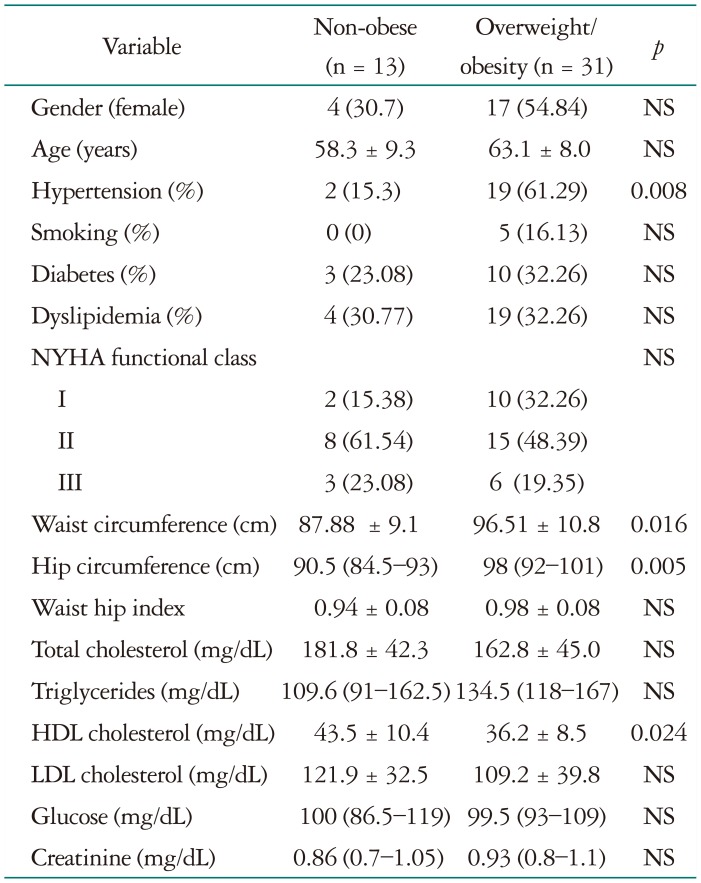
Table 1. Demographic data by groups.
Continuos variables are expresed as mean ± SD or mediana and intercuartilar range according to its distributiion. Categorical variables are presented as percentages. NYHA: New York Heart Association, NS: non significant, HDL: high-density lipoprotein, LDL: low-density lipoprotein

