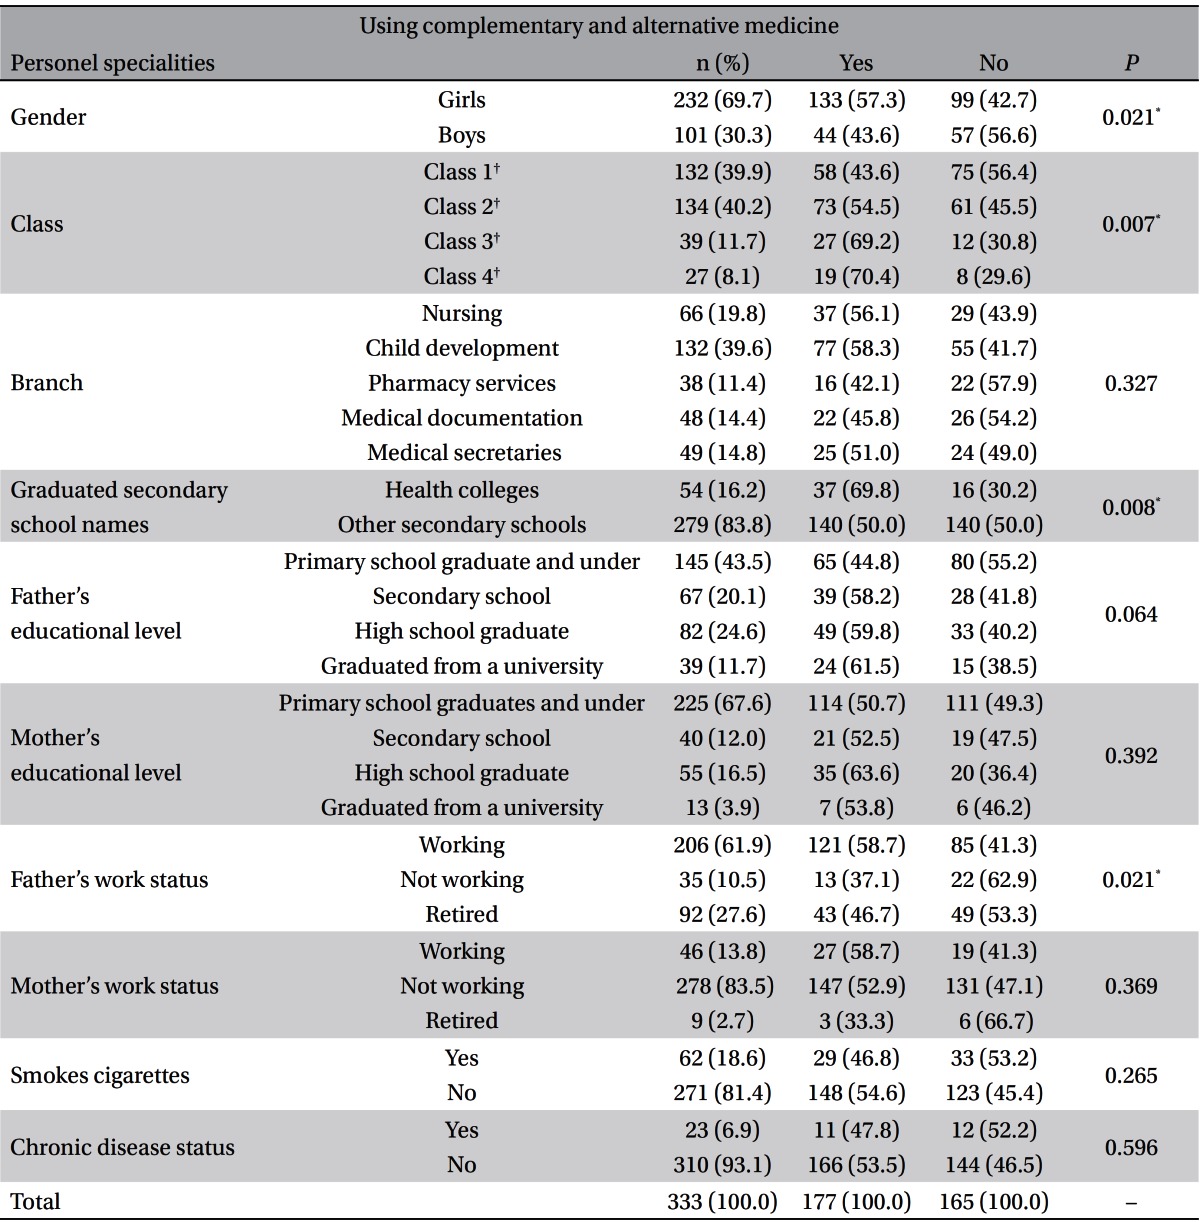
Table. 1. Effects of socio-demographic factors on the use of complementary and alternative medicine (Have you ever used?).
| Personel specialities | Using complementary and alternative medicine | ||||
|---|---|---|---|---|---|
| n (%) | Yes | No | P | ||
| Gender | Girls | 232 (69.7) | 133 (57.3) | 99 (42.7) | 0.021* |
| Boys | 101 (30.3) | 44 (43.6) | 57 (56.6) | ||
| Class | Class 1† | 132 (39.9) | 58 (43.6) | 75 (56.4) | 0.007* |
| Class 2† | 134 (40.2) | 73 (54.5) | 61 (45.5) | ||
| Class 3† | 39 (11.7) | 27 (69.2) | 12 (30.8) | ||
| Class 4† | 27 (8.1) | 19 (70.4) | 8 (29.6) | ||
| Branch#seoch# | Nursing | 66 (19.8) | 37 (56.1) | 29 (43.9) | 0.327 |
| Child development | 132 (39.6) | 77 (58.3) | 55 (41.7) | ||
| Pharmacy services | 38 (11.4) | 16 (42.1) | 22 (57.9) | ||
| Medical documentation | 48 (14.4) | 22 (45.8) | 26 (54.2) | ||
| Medical secretaries | 49 (14.8) | 25 (51.0) | 24 (49.0) | ||
| Graduated secondary school names | Health colleges | 54 (16.2) | 37 (69.8) | 16 (30.2) | 0.008* |
| Other secondary schools | 279 (83.8) | 140 (50.0) | 140 (50.0) | ||
| Father’s educational level | Primary school graduate and under | 145 (43.5) | 65 (44.8) | 80 (55.2) | 0.064 |
| Secondary school | 67 (20.1) | 39 (58.2) | 28 (41.8) | ||
| High school graduate | 82 (24.6) | 49 (59.8) | 33 (40.2) | ||
| Graduated from a university | 39 (11.7) | 24 (61.5) | 15 (38.5) | ||
| Mother’s educational level | Primary school graduates and under | 225 (67.6) | 114 (50.7) | 111 (49.3) | 0.392 |
| Secondary school | 40 (12.0) | 21 (52.5) | 19 (47.5) | ||
| High school graduate | 55 (16.5) | 35 (63.6) | 20 (36.4) | ||
| Graduated from a university | 13 (3.9) | 7 (53.8) | 6 (46.2) | ||
| Father’s work status | Working | 206 (61.9) | 121 (58.7) | 85 (41.3) | 0.021* |
| Not working | 35 (10.5) | 13 (37.1) | 22 (62.9) | ||
| Retired | 92 (27.6) | 43 (46.7) | 49 (53.3) | ||
| Mother’s work status | Working | 46 (13.8) | 27 (58.7) | 19 (41.3) | 0.369 |
| Not working | 278 (83.5) | 147 (52.9) | 131 (47.1) | ||
| Retired | 9 (2.7) | 3 (33.3) | 6 (66.7) | ||
| Smokes cigarettes | Yes | 62 (18.6) | 29 (46.8) | 33 (53.2) | 0.265 |
| No | 271 (81.4) | 148 (54.6) | 123 (45.4) | ||
| Chronic disease status | Yes | 23 (6.9) | 11 (47.8) | 12 (52.2) | 0.596 |
| No | 310 (93.1) | 166 (53.5) | 144 (46.5) | ||
| Total | 333 (100.0) | 177 (100.0) | 165 (100.0) | − |
*P < 0.05; P < 0.001; †Classes 1, 2, 3, and 4 are students educational level degrees, respectively.

