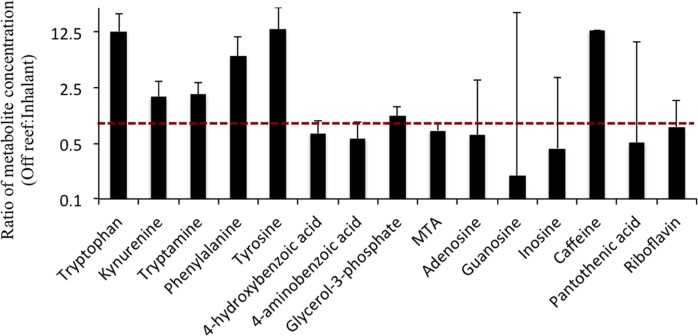
Figure 3. Average (±SD) ratios of metabolite concentrations of off reef and inhalant seawater samples (off reef/inhalant).
Note that the y-axis is presented as log2 scale to highlight equivalent concentrations (ratio = 1; red dashed line). The ratio of each metabolite was calculated by averaging individual ratios of each of the two off reef and each inhalant sample (12 ratios). MTA, 5′-methylthioadenosine. Xanthosine is not shown as it was only detected in the off reef samples.

