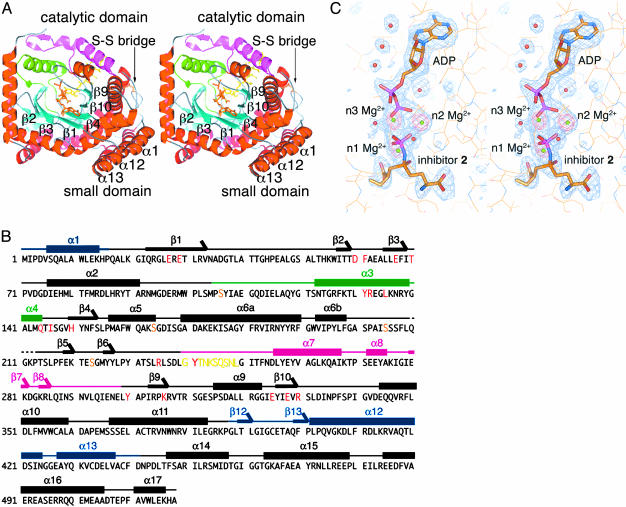
Fig. 1.
Structures of γGCS in complex with MgADP and the sulfoximine-based transition-state analog 2. (A) Top view of a schematized model of the γGCS monomer. Helices are red and β-strands are cyan. Green and magenta indicate N-terminal and central variable arms, respectively. Each strand in the central β-barrel is labeled, and the ligands bound are shown as stick models. A switch loop (residues 240–249) is depicted as a stick model in yellow. Figures were prepared with pymol (40). (B) Amino acid sequence and secondary structure of E. coli γGCS. The residue number is indicated at the beginning of each line. Residues important for interaction with the transition-state analog are highlighted in red. Thick bars above the sequences indicate α helices (labeled α1to α17), and arrows indicate β strands (labeled β1to β12). Blue, green, and pink bars show the small domain, the N-terminal variable arm, and the central variable arm, respectively. Yellow and orange letters show the region corresponding to the switch loop and the serine residues substituted for crystallization (16), respectively. (C) SIGMAA-weighted Fo – Fc omit electron density maps for the inhibitor molecule 2, three Mg2+ ions, and ADP (blue) and for only the Mg2+ ions (red). These maps are contoured at 3 and 8 σ, respectively. Inhibitor and ADP are drawn as stick models, and the protein is drawn as a line model. Mg2+ ions and water molecules are shown as green and red spheres, respectively.

