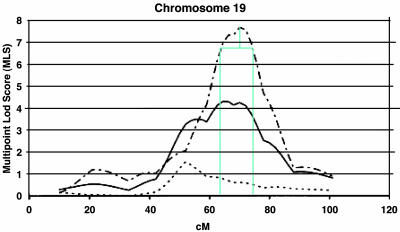
Fig. 2.
Determination of the 1-lod unit interval. We imported the published MLS AD linkage information from Blacker et al.'s (4) study into a graphical package (Microsoft visio) so that we could draw the boundaries of the 1-lod interval accurately. In this example, we subtracted one MLS from the 70-cM peak of chromosome 19 to determine a 1-lod interval between 63 and 73 cM. [Linkage peak reproduced with permission ref. 4 (Copyright 2003, Oxford University Press).]

