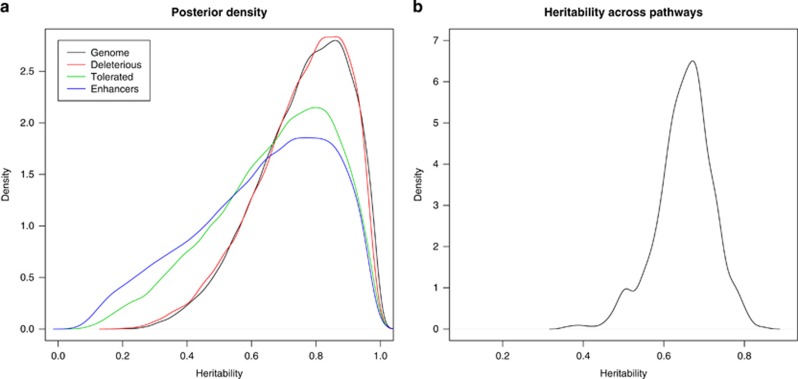
Figure 3.
(a) Posterior density of heritability when computed using either all autosomal markers (black line), non-synonymous predicted deleterious SNPs (red line), non-synonymous predicted tolerated SNPs (green line) or SNPs within enhancers (blue line). (b) Distribution of mean posterior heritabilities of domestic status across pathways. The values are the means of the posterior distribution per path. A full color version of this figure is available at the Heredity journal online.

