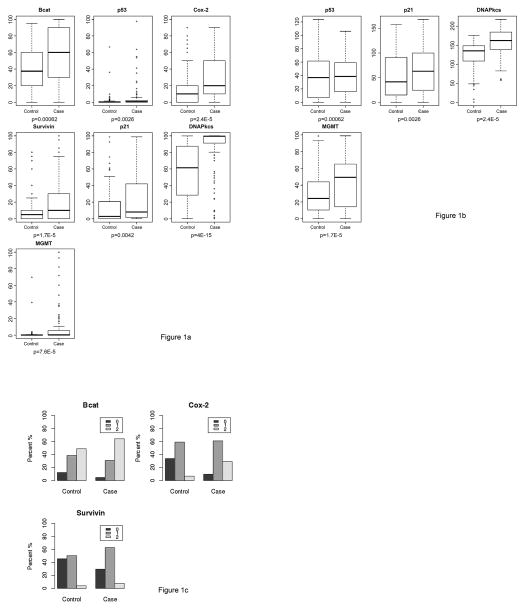
Figure 1. Distribution of molecular markers (percentage and intensity scores).
In (a–c), IHC was performed on control and case subject polyps as in methods. In (a), distribution of percent of cells staining for each marker is depicted for cases and controls. The upper and lower box boundaries represent the 25th and 75th percentiles, and the middle bar represents the median score. In (b), distribution of staining intensity for markers with objective measurement of intensity is depicted for cases and controls. The upper and lower box boundaries represent the 25th and 75th percentiles, and the middle bar represents the median score. In (c), distribution of intensity scores for markers with subjective assessment of intensity are depicted for cases and controls as 0 (lowest intensity), 1 (moderate intensity), or 2 (highest intensity). BCAT, beta catenin; DNApkcs, DNA dependent protein kinase; MGMT, 0(6)-methylguanine-DNA methyltransferase.

