Figure 1.
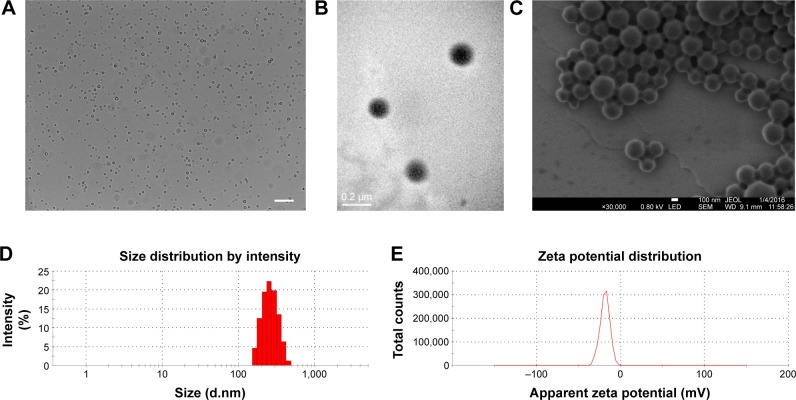
The characterization of OI-NPs.
Notes: (A) Optical microscopy images of OI-NPs, scale bar is 10 µm. (B) TEM image of OI-NPs. (C) SEM image of OI-NPs. (D) Size distribution of OI-NPs by DLS measurement. (E) The zeta potential of OI-NPs measured by DLS.
Abbreviations: DLS, dynamic light scattering; OI-NPs, oxygen and indocyanine green loaded nanoparticles; SEM, scanning electron microscopy; TEM, transmission electron microscopy.

