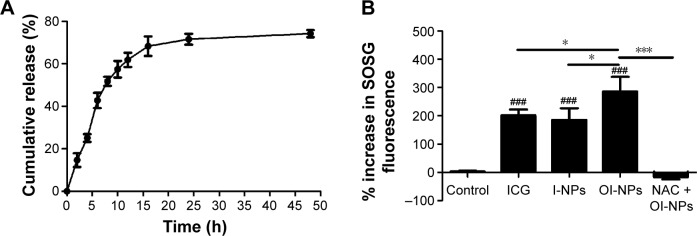
Figure 3.
Release profile of ICG from OI-NPs and ROS generation in cell-free system.
Notes: Release profile of ICG from OI-NPs in PBS at 37°C (A). Plot of % increase in SOSG fluorescence for ICG, I-NPs, OI-NPs, and NAC plus OI-NPs in degassed water with laser and ultrasound exposure (measured by fluorescence microplate reader) (B). Values are mean ± SD (n=3). ###P<0.001 versus control group. *P<0.05 and ***P<0.001 between groups.
Abbreviations: ICG, indocyanine green; I-NPs, ICG-loaded nanoparticles; NAC, N-acetylcysteine; OI-NPs, oxygen and indocyanine green loaded nanoparticles; PBS, phosphate-buffered saline; ROS, reactive oxygen species; SD, standard deviation; SOSG, singlet oxygen sensor green.

