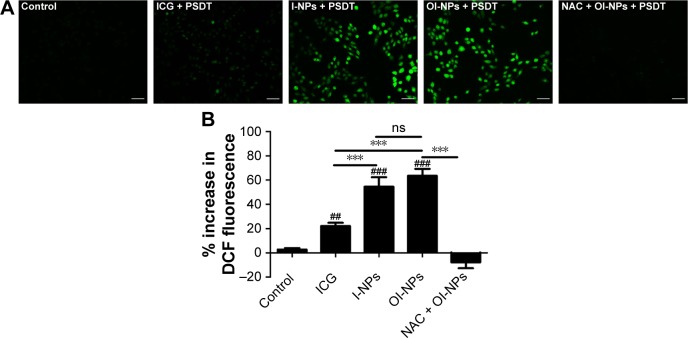
Figure 5.
Intracellular ROS production determination.
Notes: MH7A cells incubated with DCFH-DA staining for ROS detection by fluorescence microscopy images (A) Scale bar is 50 µm. (B) Plot of % increase in DCF fluorescence for ICG, I-NPs, OI-NPs, and NAC plus OI-NPs incubated with MH7A cells upon exposure to laser and ultrasound (measured by fluorescence microplate reader). The data are shown as mean ± SD (n=3). ##P<0.01 and ###P<0.001 versus control group. ***P<0.001 between groups.
Abbreviations: DCF, 2′,7′-dichlorofluorescein; DCFH-DA, 2′,7′-dichlorofluorescin diacetate; ICG, indocyanine green; I-NPs, indocyanine green loaded nanoparticles; NAC, N-acetylcysteine; ns, no significant difference; OI-NPs, oxygen and indocyanine green loaded nanoparticles; PSDT, photodynamic and sonodynamic combination therapy; SD, standard deviation.

