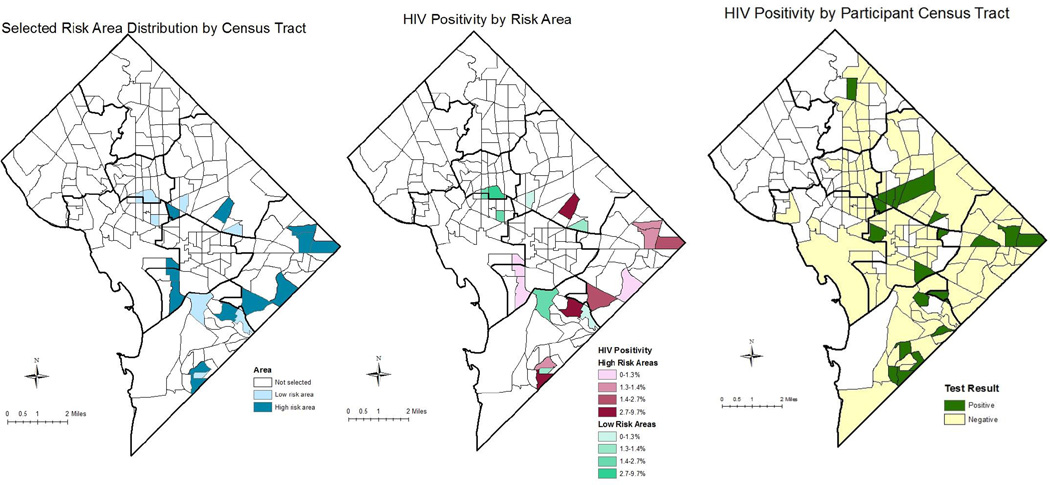
Figure 1. Geographic distribution of risk areas, and HIV positivity by risk area and participant census tract.
This figure shows the geographic distribution of the higher (HRA, n=12) and lower (LRA, n=8) risk areas where testing was conducted and the HIV positive tests by risk group area and participant residential census tract. Map A shows the distribution of the 20 census tracts selected for testing based on the statistical algorithm. Map B shows the distribution of the proportion of HIV positive tests by census tract of testing. Map C shows the distribution of HIV positive tests by the participant’s residential census tract. “Positive” implies that at least one positive HIV test was identified among a participant living in that census tract. For all maps, the darker black lines represent the borders of the 8 geopolitical designations or Wards in Washington, DC. One or more participants tested HIV positive in 16 of the 20 census tracts selected for testing. Positivity ranged from 0% to 9.7%. Participants resided throughout the city; however, most of those testing positive lived in a Ward that had been selected for testing.

