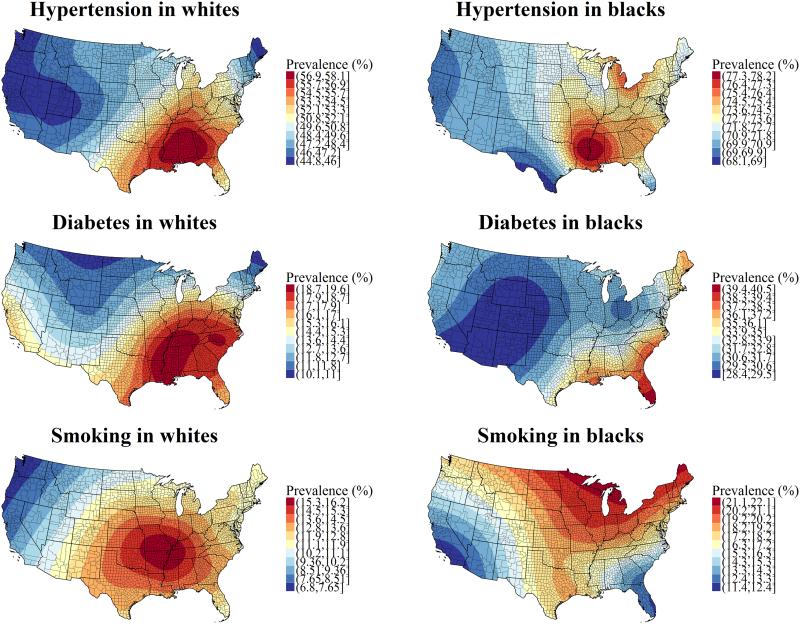
Figure 2. Maps of estimated hypertension, diabetes, and current smoking prevalence among whites and blacks, adjusted for age and gender.
High prevalence is indicated by red, while low prevalence is indicated by blue. Predicted prevalences assumed a population with the same proportion of women for each race and the same age as the mean age of each race. Thus, the prevalences reflect the gender and age composition of REGARDS participants of each race.

