Fig. 2.
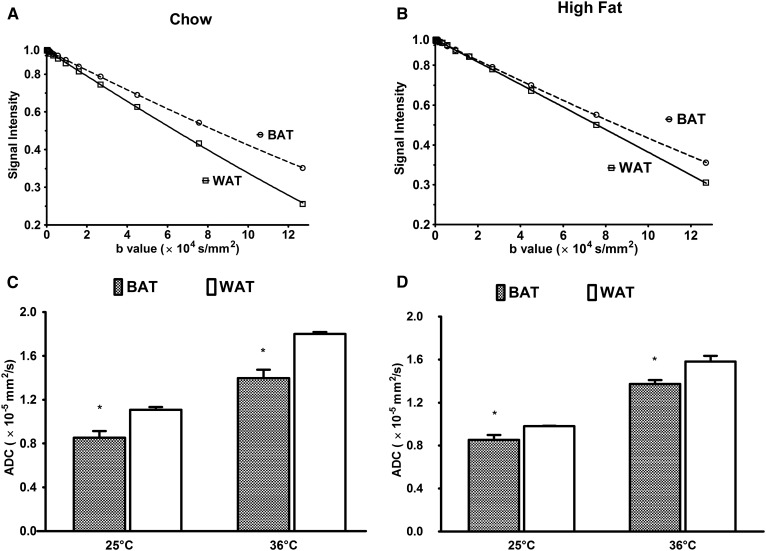
Signal attenuation and ADC of BAT and WAT in the chow and high-fat groups. Semilogarithmic plots of the signal decay for various b values and ADC are shown for the chow and high-fat cases. Diffusional decays of the fat signal in the WAT and BAT spectra (Δ = 500 ms; δ = 3 ms; τ = 0.5 ms) for chow (A) and high-fat diet (B) are shown. The ADCs are shown for 25°C and 36°C for chow (C) and high-fat diet (D). Data are presented as the mean ± SD. * P < 0.05.

