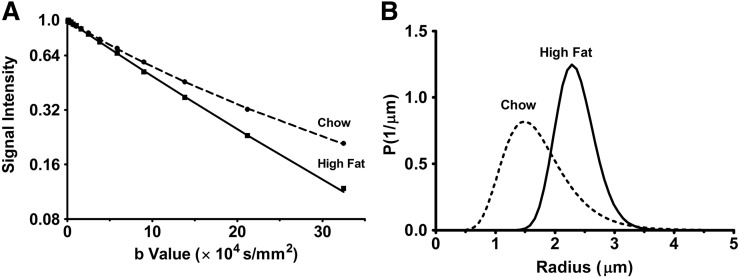
Fig. 6.
Fitting of the diffusional decays of the BAT signals with the Murday-Cotts equation and calculated droplet size distribution. A: The dotted lines (chow) and full lines (high-fat) show the nonlinear least square fitted signal decay for Δ = 2 s. B: The calculated log-normal distributions of the droplet size estimated from the corresponding best parameters in chow and high-fat tissues are displayed. The distribution curves were discretized to 64 intervals within the radius range of 0.1 to 5 μm.

