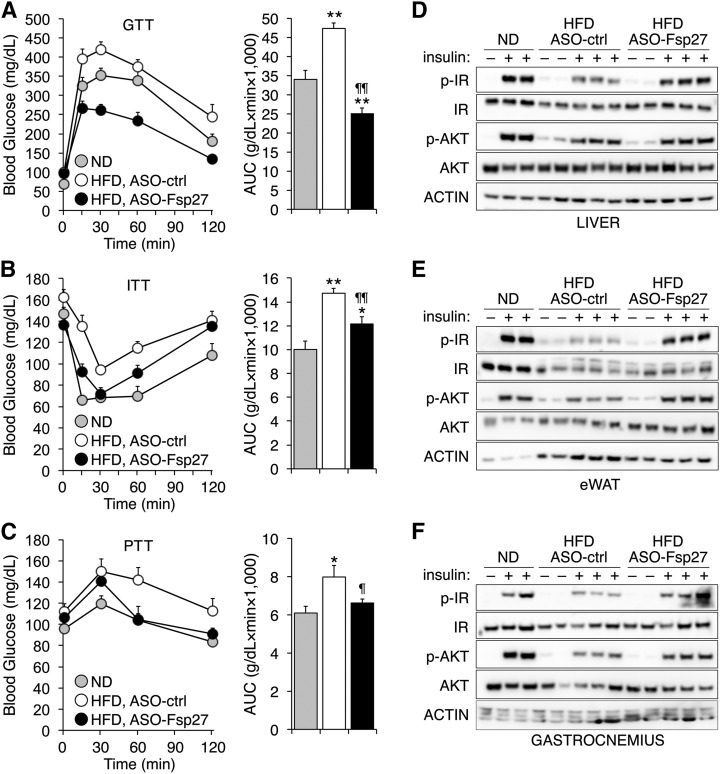
Fig. 5.
Improved whole-body glycemic control and insulin sensitivity in mice treated with ASO-Fsp27. Male C57BL/6 mice were treated as in Fig. 1A. A–C: GTT, ITT, and PTT were performed as described in Experimental Procedures. AUC, area under the curve. Data are shown as mean ± SEM (n = 8). * P ≤ 0.05 and ** P ≤ 0.01, HFD vs. ND; ¶ P ≤ 0.05 and ¶¶ P ≤ 0.01, ASO-Fsp27 vs. ASO-ctrl. D–F: Immunoblots for total and phosphorylated IR and AKT in the liver, eWAT, and gastrocnemius muscle from an independent group of C57BL/6 mice treated as above, then fasted overnight, injected ip with saline or 5 U/kg insulin, and euthanized exactly 10 min later. Quantification of signal intensities is provided in supplemental Fig. S4.

