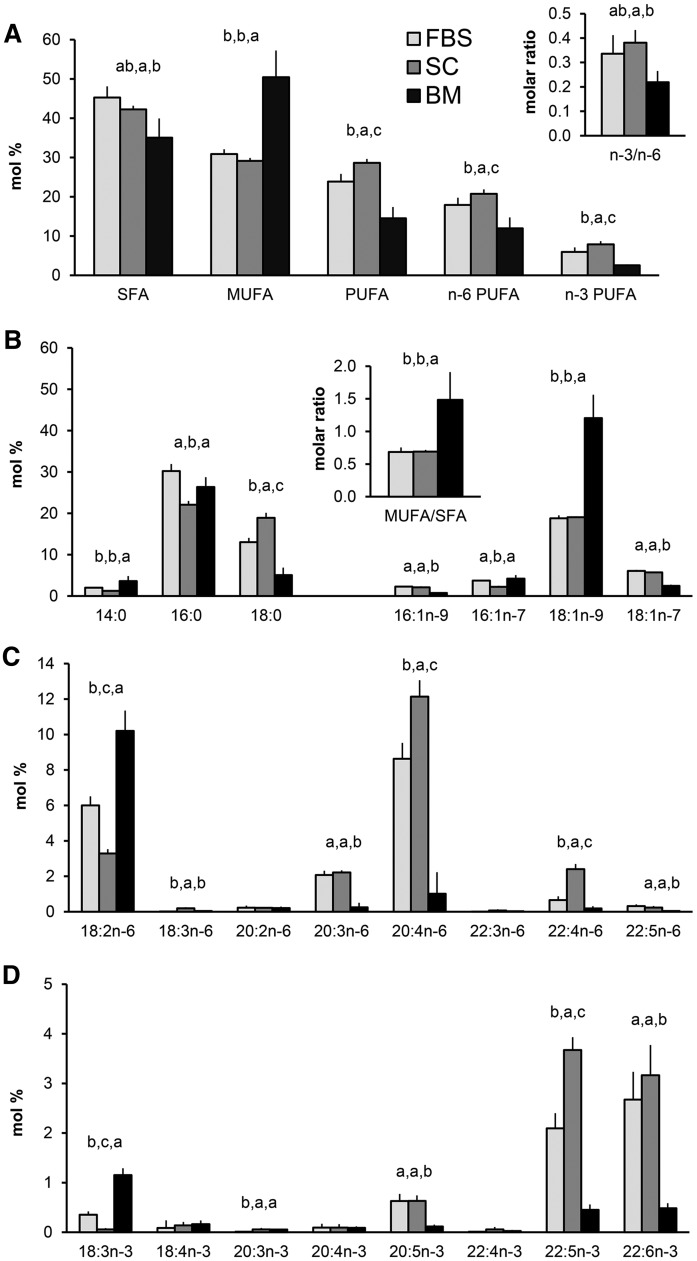
Fig. 1.
Fatty acid profiles (mole percent in total fatty acids, mean ± SD) in hBMSCs (SC, in control medium, n = 4) compared with those in different lots of FBS (n = 5) and in clinical samples of human bone marrow (BM, n = 4). A: Total proportions of SFAs, MUFAs, PUFAs, n-6 PUFAs, and n-3 PUFAs The ratio of n-3 to n-6 PUFAs (n-3/n-6) is shown in the insert. B: Individual SFAs and MUFAs. The ratio of MUFA total to SFA total is shown in the insert. C: Individual n-6 PUFAs. D: Individual n-3 PUFAs. As statistics, Kruskal-Wallis nonparametric one-way ANOVA followed by post hoc Mann-Whitney test for the means were used. The means with no common letter differed at the P < 0.05 level. Missing letters on the bars mean that the Kruskal-Wallis test showed no significant differences between the means.

