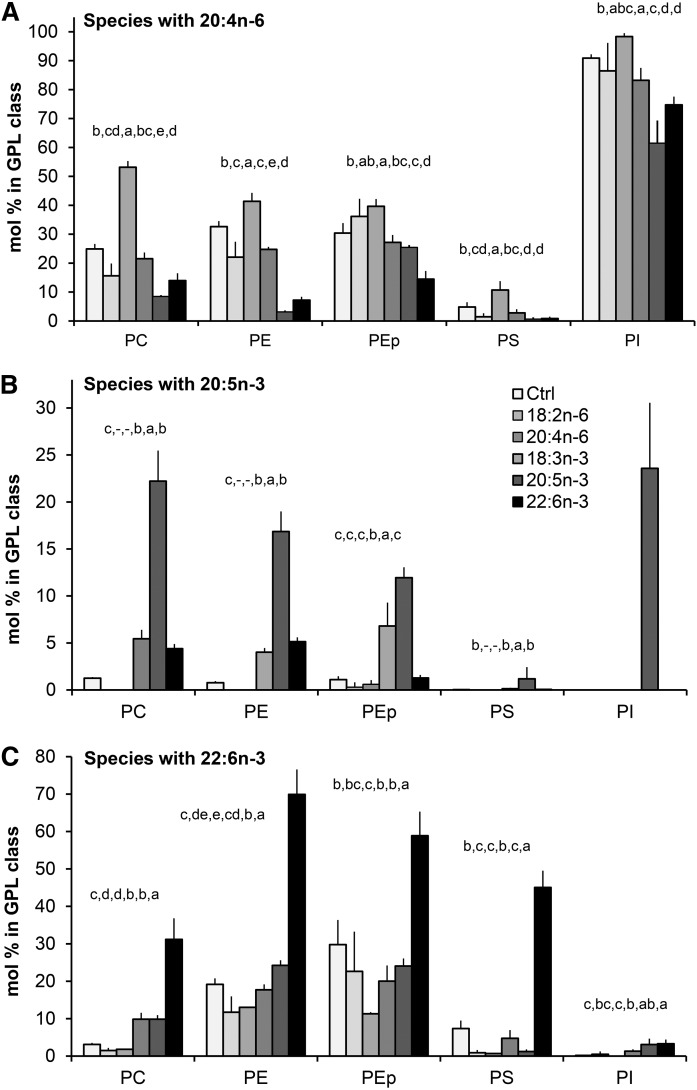
Fig. 11.
Distribution of lipid species carrying important PUFA precursors of signaling molecules between different GPL classes in hBMSCs cultured for 9 days in the control (Ctrl) medium or medium supplemented with 18:2n-6, 20:4n-6, 18:3n-3, 20:5n-3, or 22:6n-3 (mole percent sums of all species with the specific PUFA in each GPL class, mean ± SD). A: Distribution of species carrying 20:4n-6 between the GPL classes. B: Distribution of species carrying 20:5n-3 between the GPL classes. C: Distribution of species carrying 22:6n-3 between the GPL classes. Statistics are as in Fig. 1.

