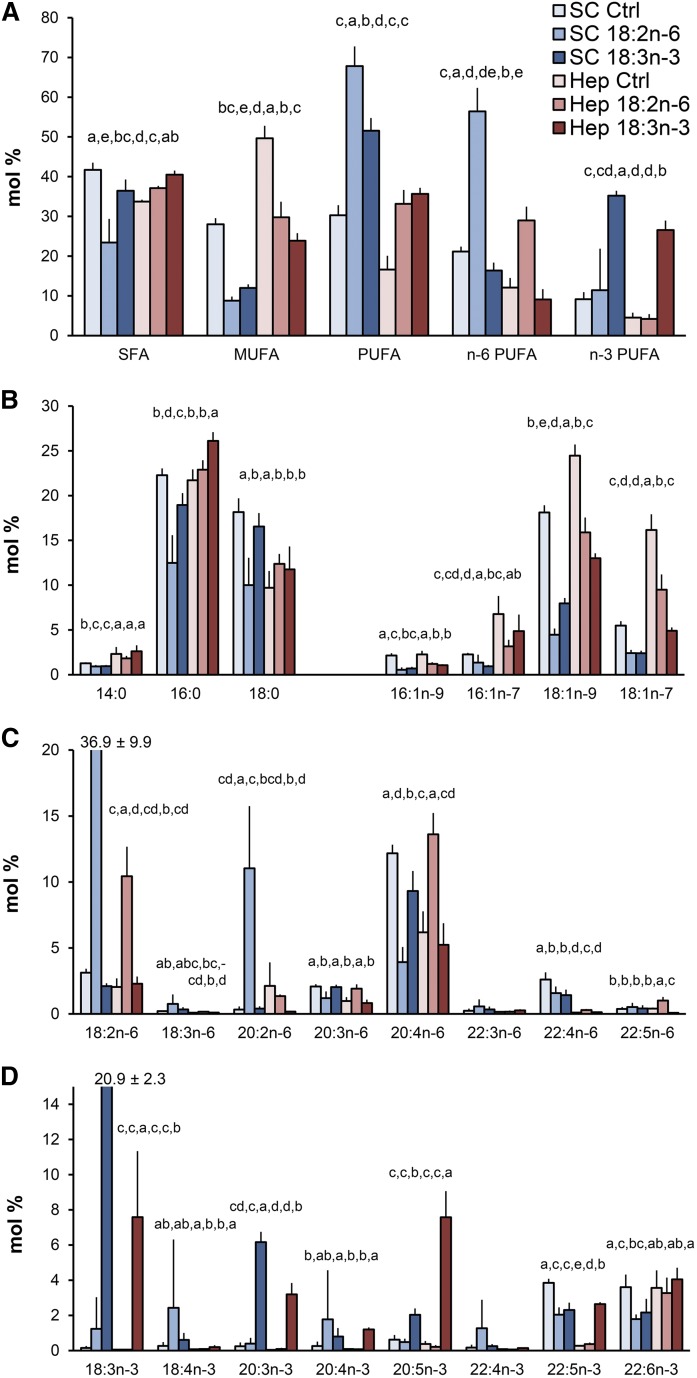
Fig. 2.
Comparison of the fatty acid profiles (mole percent in total fatty acids, mean ± SD) in control (Ctrl) and 18:2n-6- or 18:3n-3-supplemented hBMSCs (SC) and HepG2 (Hep) cells (n = 4). A: Total proportions of SFAs, MUFAs, PUFAs, n-6 PUFAs, and n-3 PUFAs. B: Individual SFAs and MUFAs. C: Individual n-6 PUFAs. D: Individual n-3 PUFAs. Statistics are as in Fig. 1. In the cases where a value exceeded the scale, the value was shown at the top of the bar.

