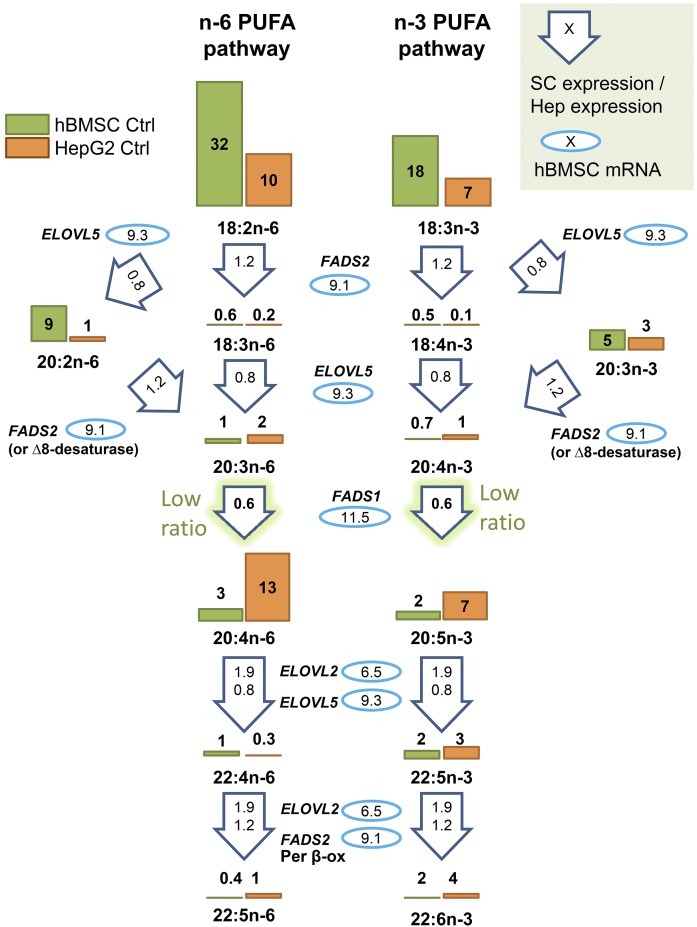
Fig. 3.
Scheme of the metabolism of n-6 and n-3 PUFAs in the hBMSCs and HepG2 cells by desaturase and elongase enzymes. The average levels of different PUFAs in hBMSCs and HepG2 cells on the pathways are visualized with bars and related values (mole percent) of the cells grown in control (Ctrl) media. The measured mRNA levels of the elongases (ELOVL5 and ELOVL2) and desaturases (FADS2, FADS1) involved are marked inside the blue ovals. The values inside the arrows are the average expression levels of the enzymes that were obtained for mesenchymal stem cells (SC) from a public online database, IST, and normalized against hepatocyte (Hep) values of the database. Per β-ox, peroxisomal partial β-oxidation.

