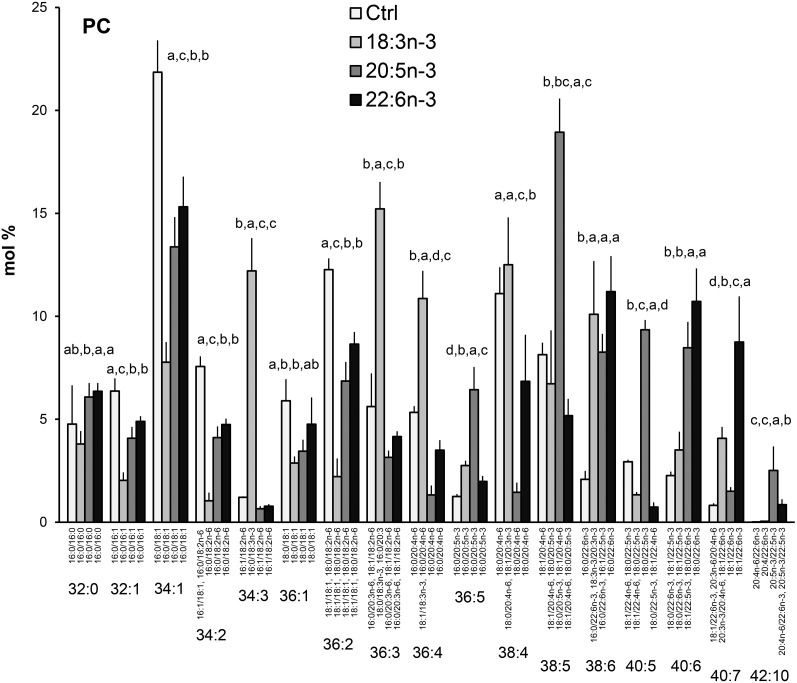
Fig. 8.
PC species profiles in hBMSCs cultured for 9 days in the control (Ctrl) medium or medium supplemented with 18:3n-3, 20:5n-3, or 22:6n-3 (mole percent per total PC, mean ± SD). For the isobaric species (marked horizontally) having more than one quantitatively important species (acyl chain combination marked vertically) the two most important are listed (in the reading order, the first one being the main species). When the double bond positions of the acyl chains were not marked, several isomers (revealed by GC-MS of fatty acids) were present in the cells for that particular chain. Statistics as in Fig. 1.

