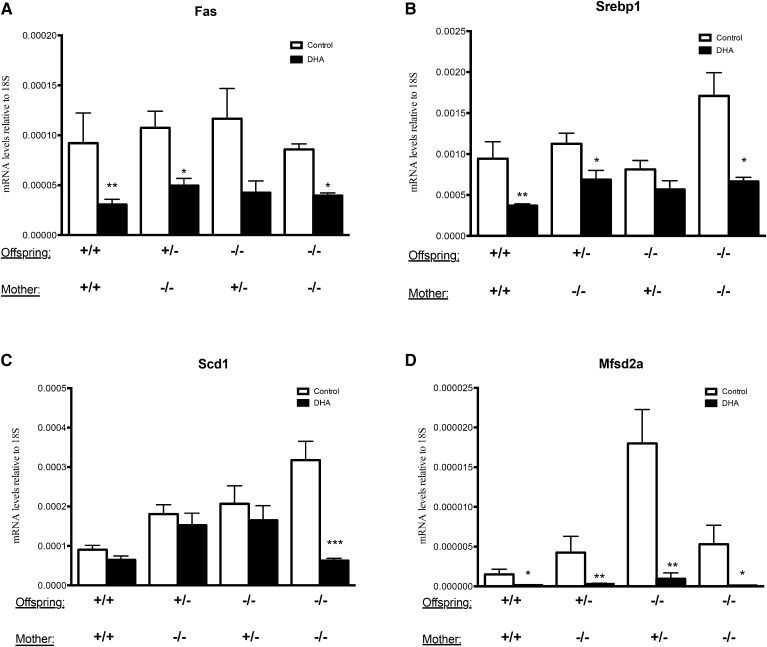
Fig. 7.
Analyses of lipogenic gene expression of Fas (A), Srebp-1c (B), Scd1 (C), and the DHA transporter Mfsd2a (D) in the liver of offspring with Elovl2+/+ (+/+), Elovl2+/− (+/−), and Elovl2−/− (−/−) genotype delivered by Elovl2+/+ (+/+), Elovl2+/− (+/−), and Elovl2−/− (−/−) mothers fed either control diet (Control) or DHA-enriched diet (DHA) expressed as relative mRNA levels (target gene/18S). Results are presented as mean ± SEM of two to five mice. *P < 0.05, **P < 0.01, ***P < 0.001.

