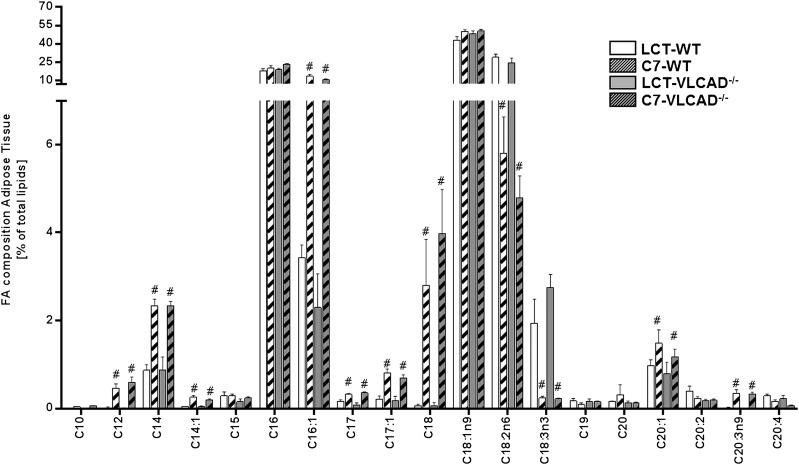
Fig. 6.
Fatty acid profiles from adipose tissue of mice under either a control or a triheptanoin diet. Values are means ± SEM (n = 10–12). #Significant differences (P < 0.05, two-way ANOVA and Student’s t-test) between mice of the same genotype under different dietary regimen. DBS, dried blood spot; LCT, long-chain triglyceride.

