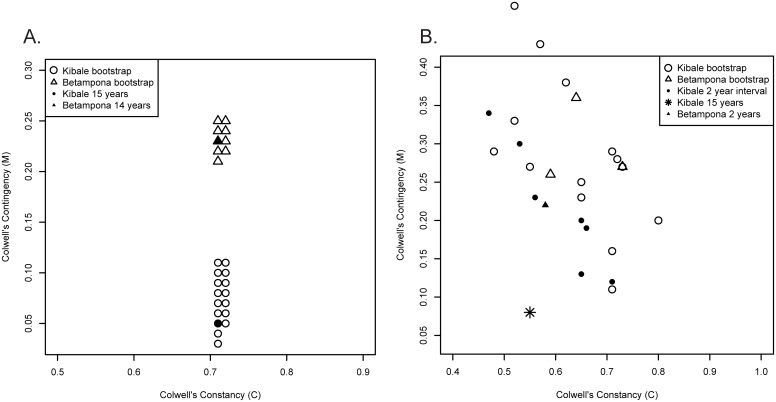
Fig 2. A comparison of Colwell’s index of predictability (P) of temperature and fruit availability at Kibale and Betampona.
(A) Colwell’s constancy (C) versus contingency (M) for 15 years of temperature data at Kibale (filled circle) and Betampona (filled triangle); both have been bootstrapped 100 times (open triangles and circles). (B) Colwell’s constancy (C) versus contingency (M) for 15 years and for two-year intervals of total fruit availability at Kibale (star and filled circles, respectively), and 2-years of fruit availability at Betampona (filled triangle); both have been bootstrapped 100 times (open triangles and circles).

