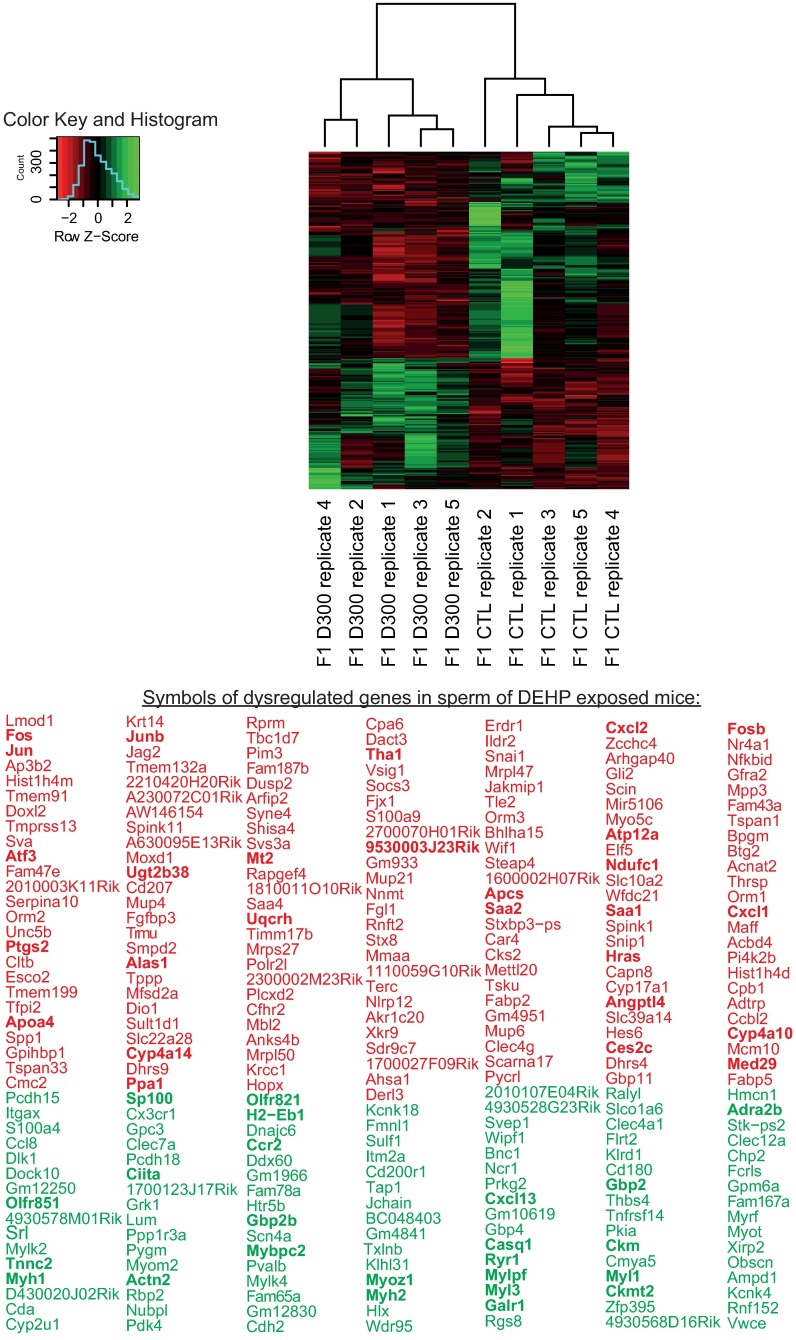
Fig 2. Sperm RNA expression changes after prenatal exposure to DEHP.
Clustering and heat map analysis performed on the 283 genes that were significantly differentially present or expressed in sperm of controls (CTL) and DEHP exposed mice (D300). Data correspond to 10 RNA-seq experiments analyzed with TopHat-Cuffdiff pipeline [16]. Measurements were obtained in the five D300 individual samples clustering together on the left and five CTL individual samples clustering on the right of the heat map. The 173 genes down-regulated in D300 mice are presented under their official gene symbols in red; the 110 genes up-regulated in D300 mice are presented under their official gene symbols in green. The genes identified in a network are presented in bold.

