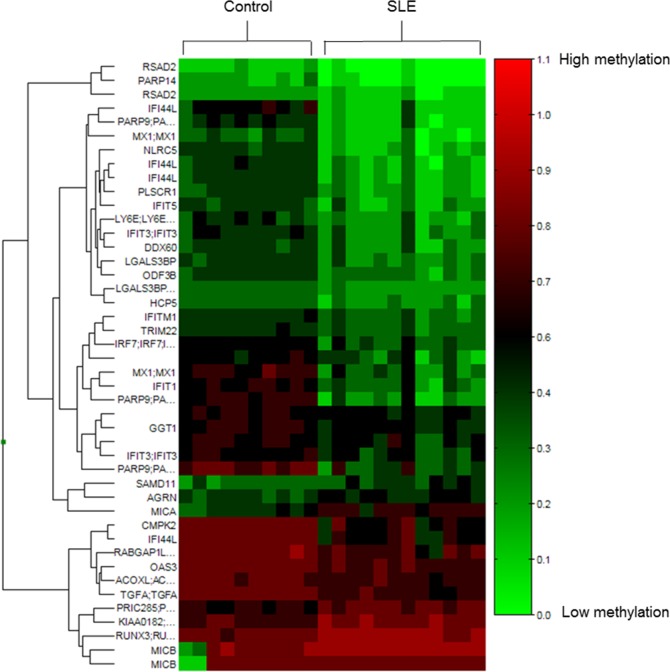
Fig 2. Heat map visualization of differentially methylated CpG sites.
Forty-four differentially methylated CpG sites of 10 controls and 12 SLE patients are shown. CpG sites are clustered using Manhattan clustering, and the corresponding gene name of the CpG site is also shown on the left (if any). A scale is shown on the right, in which red and green correspond to a higher and a lower methylation status, respectively.

