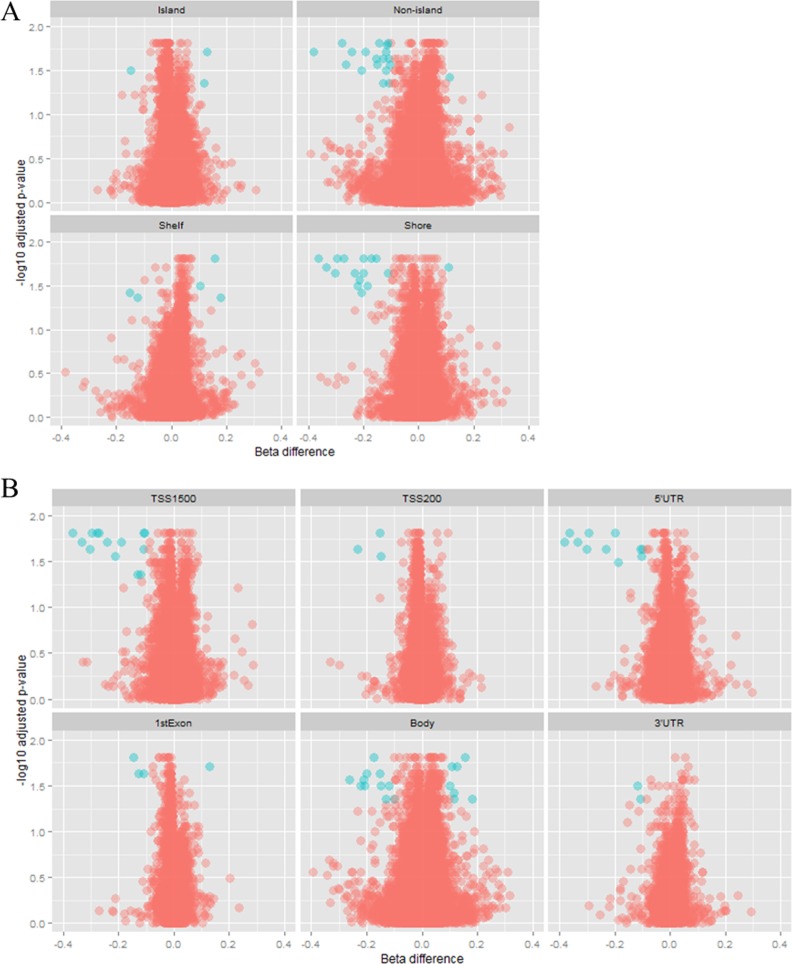
Fig 3. Volcano plot showing DNA methylation data according to genomic distribution.
Blue spots represent CpG sites that are considered to be differentially methylated, fulfilling the requirement of a beta difference > |0.1| and log transformed adjusted p-value > 1.3, whereas red spots represent CpG sites that are not differentially methylated. (A) CpG sites are classified in relation to CpG islands. Most of the differentially methylated probes are located in shores and non-islands. (B) CpG sites are classified in relation to the gene structure, and most of the differentially methylated CpG sites are located in the 5’UTR, 1500 bp upstream of the TSS and in the gene body.

