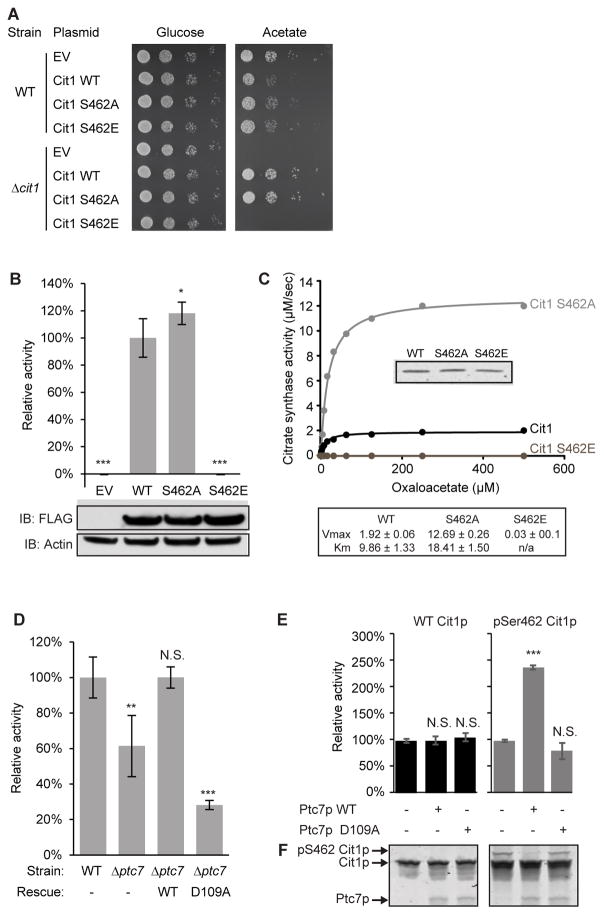
Figure 3. Phosphorylation of Cit1p at S462 disrupts enzyme function.
(A) Serial dilutions of WT and Δcit1 yeast expressing various plasmids grown on glucose- or acetate-containing Ura− plates.
(B) Citrate synthase activity of Δcit1 lysate expressing EV, WT, S462A, or S462E Cit1p (mean ± SD, n=3). Statistics are relative to WT activity (lane #2). Inset shows immunoblot against FLAG (Cit1p-FLAG), or actin (loading control).
(C) Kinetic curve of recombinant WT, S462A, or S462E Cit1p. Citrate synthase activity (μM/sec) is plotted versus concentration of OAA (μM). Inset shows comparable loading (Coomassie staining). Table shows calculated Vmax and Km for each Cit1p mutant.
(D) Citrate synthase activity of lysate from WT or Δptc7 (mean ± SD, n=4). Rescue strains express a plasmid containing ptc7 (WT: wild type ptc7; D109A: catalytically inactive mutant of ptc7).
(E) Citrate synthase activity of recombinant WT or phospho-S462 (pSer462) Cit1p treated with WT or D109A Ptc7p (mean ± SD, n=3).
(F) Coomassie staining of a PhosTag gel loaded with samples in (E).
* p-value < 0.05; ** p-value < 0.01; *** p-value < 0.001; N.S., not significant.
See also Figure S3.

